Average Fulham House Price Reaches Record High During Lockdown
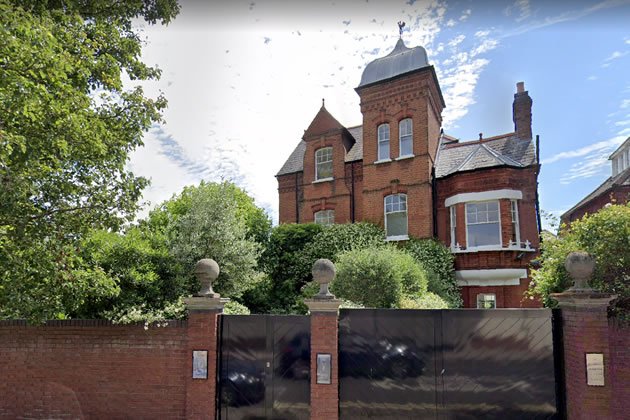
One detached property in SW6 changes hands for £8,000,000

House on Fulham Park Road sold for £8,000,000 during lockdown
Expectations of a sharp fall in house prices during the pandemic appear to have been confounded with prices in the Fulham area reaching record levels.
According to the latest figures released by the Land Registry, the average price of a property in the SW6 postcode area sold in the second quarter of the year, during which the country was in lockdown, reached £1,312,294, the highest three month average on record.
In more recent months the level has fallen back with the average for the third quarter of the year at £1,218,478, still a 15.5% increase on the same period in 2019.
The reasons for the rise appear to be the increased proportion of larger family houses being sold whereas turnover in flats and maisonettes is well below normal levels.
Since the end of March there have been 31 transactions reported at over £2,000,000 including one for a house on Chipstead Street which changed hands for £4,100,000. Even that is well below the highest price paid during this period which was £8,000,000 for a detached house on Fulham Park Road. This is the sixth highest price ever paid for a residential property in Fulham.
One local estate agent said, “A two tier market has developed in the area with vendors of larger properties quick to accept reasonable offers aware that the stamp duty reduction may not be extended. At lower price levels the saving may be less and so it has been harder to reach agreement. Buyers are expecting big mark downs from the price at which a sale is listed but there aren’t many distressed sellers out there just yet.”
| Fulham Property Prices (July - September 2020) | ||||||||
|---|---|---|---|---|---|---|---|---|
| Area | Semi-det | Sales | Terraced | Sales | Flat/ mais |
Sales | Overall ave | Total sales |
| SW6 1 | 0 | 0 | 630000 | 1 | 630000 | 2 | 630000 | 3 |
| SW6 2 | 0 | 0 | 1975000 | 3 | 684693 | 14 | 912394 | 17 |
| SW6 3 | 2200000 | 1 | 2338375 | 8 | 786400 | 5 | 1774214 | 14 |
| SW6 4 | 0 | 0 | 1690556 | 9 | 689562 | 4 | 1382558 | 13 |
| SW6 5 | 0 | 0 | 1769000 | 5 | 541333 | 3 | 1308625 | 8 |
| SW6 6 | 0 | 0 | 800000 | 1 | 697500 | 2 | 731667 | 3 |
| SW6 7 | 0 | 0 | 1481667 | 6 | 677857 | 7 | 1048846 | 13 |
| Total | 2200000 | 1 | 1788242 | 33 | 683782 | 37 | 1218478 | 71 |
| Change over quarter | - | - | -2.3% | 10.0% | -18.7% | -28.8% | -7.1% | -17.4% |
| Change over year | - | - | 8.5% | -54.2% | -5.3% | -76.0% | 15.5% | -69.7% |
| Change over three years | - | - | 4.1% | -48.4% | -18.8% | -74.7% | 6.0% | -67.1% |
| Change over five years | - | - | 4.0% | -63.3% | -15.9% | -82.9% | 10.6% | -77.1% |
| Change over ten years | - | - | 64.2% | -77.6% | 50.5% | -79.1% | 60.0% | -78.4% |
Source: Land Registry
Nationally the Nationwide House Price Index showed a year on year increase of 5% to £226,129 up to the end of September. For London the average has risen by 4.4% over the year to £480,857.
Robert Gardner, Nationwide's Chief Economist, said: “Housing market activity has recovered strongly in recent months. Mortgage approvals for house purchase rose from c66,000 in July to almost 85,000 in August - the highest since 2007, well above the monthly average of 66,000 prevailing in 2019.
“The rebound reflects a number of factors. Pent-up demand is coming through, with decisions taken to move before lockdown now progressing. The stamp duty holiday is adding to momentum by bringing purchases forward. Behavioural shifts may also be boosting activity as people reassess their housing needs and preferences as a result of life in lockdown.”
Updates on the local property market are regularly published in the Fulham newsletter.
November 13, 2020
