Five Million Pound House Helps Boost SW6 Property Market
But overall picture shows prices of houses and flats continuing to fall
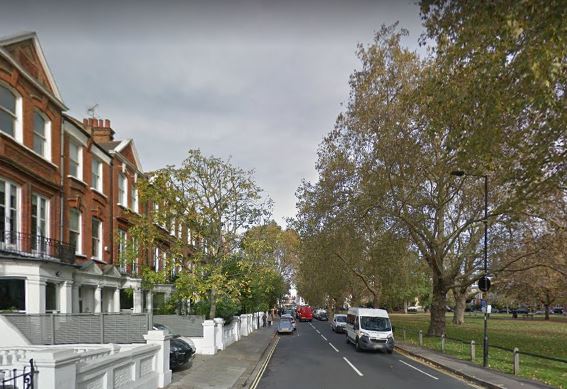
Parsons Green. Picture: Google Streetview
A handful of houses and flats achieving multi-million pound prices boosted the average property value in Fulham to £1,149,846 in the last three months of 2018 - up 4.3% from the previous quarter.
Among houses, the most expensive was a six bedroom house in Parsons Green which sold for £5,000,000 - the fourth highest price achieved for a house in SW6.
Two others, both in Napier Avenue, close to Hurlingham Park and Club, fetched £3,925,000 and £3,405,000 and one in Hurlingham Road was sold for £3,490,000.
These transactions at the very top of the market helped to drive the average price of semi-detached houses up by 10.5% and terraced houses by just 0.7% from the previous three months.
Looking at the longer term picture however, the picture is less positive. The average price of a terraced house - £1,599,319 - was down 9% over the the same period in the previous year.
Among flats, one noticeable development was that while a few newly built apartments changed hands in Fulham High Street's Cawthorn Apartments, a growing number of recently built properties are now being sold on to new investors.
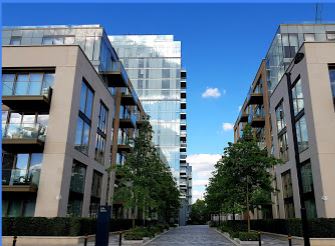
These resales included two luxury apartments at Lillie Square in Seagrave Road, pictured below, which fetched £4,900,000 and £3,125,000.
Despite these huge price tags however, the average flat value in Fulham - £741,243 - was down by 6.3% from the previous quarter and a huge 24.4% from the same period in 2017.
This continuing fall in prices is of course good news for first time buyers and young people with tight budgets, with an increasing number of properties selling for under £400,000 and several small flats changing hands for under £300,000, including two in Farm Lane, close to Fulham Broadway, one in Dairy Close in Parsons Green.
These plummeting prices were matched by a slide in the number of sales, which were down 26.1% from the previous three months and 34.7% lower than the same period the previous year.
Estate agent Chestertons, who have three offices in Fulham, say,"The climate of heightened Brexit related
political uncertainty coming into 2019 has
made buyers and sellers more hesitant. This is frustrating
the considerable pent up demand which is
waiting to be released.
"We do not expect Greater London prices to
see much growth over the next 12 months.
However, neither should they suffer any
dramatic decline, barring a major shock in
the wider economy and if demand continues
to outpace supply."
On an optimistic note, the agency adds, " Our offices
have also noted an increase in gazumping,
which further suggests that the market may
be close to bottoming."

UK house prices grew by 2.5% in the year to December 2018. This is the lowest annual growth for the UK since July 2013. London property prices fell marginally over the year with only the North East also seeing a decline.
Tom Bill, Partner and Head of London Residential Research at Knight Frank said, "The influence of political uncertainty on the prime London property market has grown markedly in the last six months. In the first half of 2018 there were signs the market was beginning to rally as asking prices adjusted more fully to reflect higher transaction costs.
"However, with Brexit uncertainty persisting ahead of the UK’s planned departure from the EU, sales volumes in prime outer London were down by 10% year-on-year in January and the annual price decrease widened to 4.6%.
"Identifying individual factors affecting the performance of the prime London property market can be a complex task but the impact of political uncertainty was decisive during 2018. Indeed, economic sentiment indicators displayed a similar trend. The Lloyds business barometer began the year with a reading of 35% in January but had fallen to 17% by December.
"However, there are signs that pent-up demand is building. The number of new prospective buyers registering rose by 5% across prime London markets in 2018. Indeed, the ratio of new demand to new supply rose to 4.9 in the final quarter of 2018, the highest level in four years.
While it is unknown when the current level of political uncertainty will recede, the conditions for a recovery in the London property market appear to be taking shape.
Robert Gardner, Nationwide's Chief Economist, said ““Indicators of housing market activity, such as the number of property transactions and the number of mortgages approved for house purchase, have remained broadly stable in recent months, but forward-looking indicators had suggested some softening was likely.
“In particular, measures of consumer confidence weakened in December and surveyors reported a further fall in new buyer enquiries towards the end of 2018. While the number of properties coming onto the market also slowed, this doesn’t appear to have been enough to prevent a modest shift in the balance of demand and supply in favour of buyers in recent months.”
The Bank of England’s Agents’ summary of business conditions for 2018 Q4 reported that along with low supply of houses, demand was also falling. Housing activity in southern England was muted due to uncertainty, with transactions postponed until after the EU withdrawal. The demand for new build houses remained stronger outside London, in part due to house builders offering more incentive to finalise sales.
The Royal Institution of Chartered Surveyors’ (RICS) UK Residential Market Survey for December 2018 reported that new buyer enquiries fell for the fifth month in a row. This fall in demand was accompanied by a lack of fresh stock coming into the market as the survey’s indicator on new instructions remained in negative territory for the sixth report in a row.
The UK Property Transactions Statistics for December 2018 showed that on a seasonally adjusted basis, the number of transactions on residential properties with a value of £40,000 or greater was 102,330. This is 3.6% higher than a year ago. Between November 2018 and December 2018, transactions fell by 0.1%.
The Bank of England’s Money and Credit latest release showed that mortgage approvals for house purchases (an indicator of future lending) were around 63,800 in December, unchanged from November, but slightly below their 2018 average of around 65,200.
Updates on the local property market are regularly published in the Fulham newsletter.
| Fulham Property Prices (October - December 2018) | ||||||||
|---|---|---|---|---|---|---|---|---|
| Area | Semi-det | Sales | Terraced | Sales | Flat/ mais |
Sales | Overall ave | Total sales |
| SW6 1 | 1625000 | 1 | 1775000 | 1 | 1462000 | 7 | 1514889 | 9 |
| SW6 2 | 1100000 | 1 | 1459417 | 6 | 639486 | 28 | 793203 | 35 |
| SW6 3 | 3405000 | 1 | 2225833 | 12 | 995115 | 13 | 1655827 | 26 |
| SW6 4 | 0 | 0 | 2057336 | 11 | 533643 | 7 | 1464789 | 18 |
| SW6 5 | 2350000 | 1 | 1564500 | 4 | 623214 | 7 | 1080875 | 12 |
| SW6 6 | 2987500 | 2 | 1291250 | 12 | 671067 | 15 | 1093700 | 30 |
| SW6 7 | 0 | 0 | 1095787 | 16 | 524800 | 10 | 876177 | 26 |
| Total | 2409167 | 6 | 1599319 | 62 | 741243 | 87 | 1149846 | 156 |
| Change over quarter | 10.5% | 0.0% | 0.7% | -13.9% | -6.3% | -34.6% | 4.3% | -26.1% |
| Change over year | 8.1% | 100.0% | -9.0% | -1.6% | -24.4% | -49.7% | -4.3% | -34.7% |
| Change over three years | - | - | -8.3% | -19.5% | -16.0% | -51.1% | 0.7% | -38.8% |
| Change over five years | 17.9% | -25.0% | 15.8% | -27.1% | 16.2% | -66.5% | 33.7% | -56.1% |
| Change over ten years | - | - | 101.4% | 55.0% | 70.7% | 29.9% | 102.1% | 45.8% |
March 22, 2019