Steady Demand for SW6 Property as Buyers Develop 'Three Year Itch'
Market boosted by £4 million houses in Parsons Green and new flats in Lillie Road
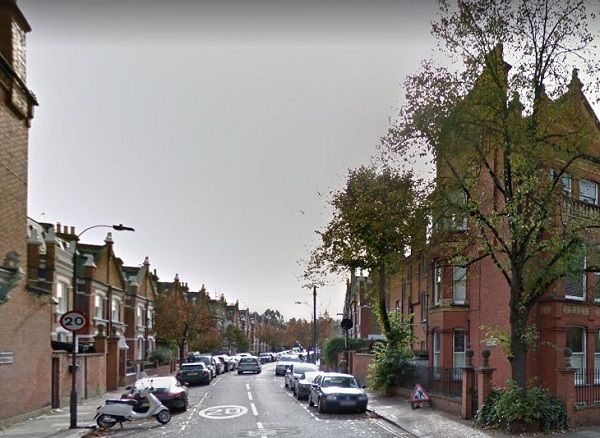 Bradbourne Street in Parsons Green. Picture: Google Streetview
Despite the looming shadow of Brexit and the coming General Election, there remains a steady demand for all types of property in Fulham, with the overall average price rising in the third quarter of 2019 to £1,136,518 - up by a modest 2.3% over the previous quarter and also up 5.7% compared with the same period last year.
The latest figures from the Land Registry show the average cost of terraced houses, meanwhile rose to £1,681,274 - up by 4% over the previous quarter and 5.9% over the previous year. This was partly driven by a handful of very high priced sales of houses in SW6's most sought after streets.
As in the previous quarter, the most expensive house was in Bradbourne Street in Parsons Green. It fetched £4,250,000, and a second house in the same street changed hands for £3,900,000.
In Napier Avenue, next to the Hurlingham Club, meanwhile a house was sold for £4,000,000.
There were also a number of sales in these areas and in the 'ABC' streets by the river with price tags between two and three million pounds. However the vast majority of terraced houses - almost 50 - were sold for between one and two million.
The average price of flats meanwhile fell by 4.9% to £738,103 but this was mainly due to the type of properties changing hands. While one apartment at Lockside House in Chelsea Creek was sold for £3,600,000, along with a handful of high priced resales at this and other upmarket developments, most flat sales changed hands for well under one million.
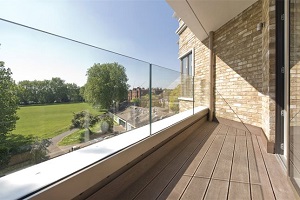
These included sales at two popular new developments, Cawthorn Apartments in Fulham High Street and McKenzie House, overlooking Lillie Road Recreation Ground, pictured above, where nine flats were sold for between £564,000 and £880,000.
There was also some good news for Fulham's first time buyers, with a number of flats changing hands for under £400,000.
Local estate agent Aspire says that pent-up demand is now lending new pace to the local market, adding: " Many buyers and sellers put their moving aspirations on ice back in June 2016 for fear of the unknown. Some will have banked on a definite withdrawal from the EU on 29th March 2019 but with drawn-out negotiations, the general public are developing what we’re calling a ‘three year itch’ and are now reigniting their property plans.
" Aspire has been charting house prices in South West London over the last 12 months and has noted a year-on-year uplift. This reflects increasing mobility in the local market and a willingness among movers to press on with plans, despite the ongoing Brexit saga.
" Encouragingly, interest rates remain attractively low, creating excellent moving conditions for those who simply can’t delay buying or selling any longer."
| Fulham Property Prices (July-September 2019) | ||||||||
|---|---|---|---|---|---|---|---|---|
| Area | Semi-det | Sales | Terraced | Sales | Flat/ mais |
Sales | Overall ave | Total sales |
| SW6 1 | 0 | 0 | 2387500 | 2 | 594667 | 9 | 920636 | 11 |
| SW6 2 | 1482000 | 1 | 1042000 | 5 | 850792 | 20 | 911840 | 26 |
| SW6 3 | 0 | 0 | 2303583 | 12 | 980909 | 11 | 1671000 | 23 |
| SW6 4 | 2900000 | 1 | 1790000 | 8 | 593857 | 7 | 1336063 | 16 |
| SW6 5 | 0 | 0 | 1882000 | 5 | 576621 | 14 | 920142 | 19 |
| SW6 6 | 2850000 | 1 | 1630555 | 14 | 838500 | 10 | 1362511 | 25 |
| SW6 7 | 0 | 0 | 1224797 | 15 | 675955 | 22 | 898458 | 37 |
| Total | 2410667 | 3 | 1681274 | 61 | 738103 | 93 | 1136518 | 157 |
| Change over quarter | - | - | 4.0% | -1.6% | -4.9% | -12.3% | 2.3% | -8.2% |
| Change over year | - | - | 5.9% | -15.3% | -4.2% | -35.0% | 5.7% | -29.0% |
| Change over three years | - | - | -0.6% | 27.1% | -23.0% | -34.0% | -2.2% | -17.8% |
| Change over five years | - | - | -13.3% | -40.8% | -1.5% | -50.3% | -3.7% | -46.2% |
| Change over ten years | - | - | 67.7% | -53.8% | 78.3% | -32.6% | 60.9% | -42.5% |

The Land Registry House Price Index for August 2019 shows that overall prices were down by 1.4% in London which made it the worse performing area in the UK. For the country as a whole the average price rose by 1.3% to £234,853.
The Royal Institution of Chartered Surveyors’ (RICS) August 2019 UK Residential Market Survey reported a flat trend in demand (new buyer enquiries) at the national level, following a few months in which enquiries had increased modestly. Newly agreed sales moved slightly further into negative territory. Alongside this, new instructions to sell were broadly unchanged for the third successive report.
The Bank of England’s Agents‘ summary of business conditions – 2019 Q3 reported that the housing market continued to soften, reflecting deteriorating supply and demand. Estate agents reported softer demand in the secondary market, though demand for lower-priced properties was more resilient.
The UK Property Transactions Statistics for August 2019 showed that on a seasonally adjusted basis, the estimated number of transactions on residential properties with a value of £40,000 or greater was 99,890. This is 0.9% higher than a year ago. Between July 2019 and August 2019, transactions increased by 15.8%.
The Bank of England’s Money and Credit release reported that mortgage approvals for house purchase (an indicator of future lending) decreased in August 2019 to 65,500. This is down from the previous peak seen in July 2019 of 67,000 but remained within the narrow range seen over the past 3 years.
Updates on the local property market are regularly published in the Fulham newsletter.
November 29, 2019