Average Fulham Property Price Slides from All Time High
But value of flats in SW6 climb to highest ever level
The average property price in Fulham slipped back in the fourth quarter of 2013 - but the value of flats continued to climb.
The overall average fell by 7.6% from £969,089 in the previous quarter to £894,976. However this figure was still up by 25.5% over the year.
While house prices retreated as temperatures dropped - semi-detached homes by 21.6% from £2,606,586 to £2,043,125 and terraced homes by 12% from £1,568,307 to £1,380,745 -flat prices continued to rise, up by 4.1% to reach all time high average of £652,828.
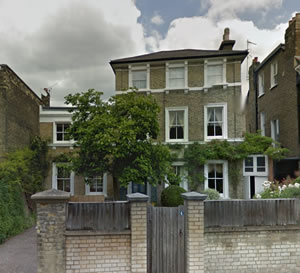
The very top of the market also continued to thrive. A semi-detached house in Fulham Park Gardens changed hands for £4,732,500, making it SW6's third most expensive home and the highest priced house - the two higher priced properties were apartments in upmarket developments.
A house on Quarrendon Street, meanwhile sold for £4,275,000, becoming Fulham's most expensive ever terraced property.
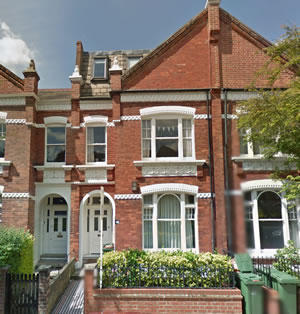
Quarrendon Street
This looks set to continue in 2014 with wesbite Rightmove listing 20 homes priced over £3 million in the Fulham area, eight with price tags of above £4 million.
Estate agent Marsh and Parsons' figures for the fourth quarter of 2013 show that Fulham was one of the hotspots in areas it calls the Outer Prime London villages, along with Barnes, Clapham, Battersea and Balham, all outpacing Prime Central London - areas like Chelsea and Notting Hill.
Marsh and Parsons' Alex Lyle says: " The 2013 property market in SW6 was defined by a limited supply of property for sale and a growing number of buyers coming to the market.
"The highest price rises we have seen are the freehold houses, which have risen by at least 15%, and in some cases, by as much as 20% for the most premium properties, for example in the Moore Park Estate and Alphabet Streets."
He adds: " As we move into the Spring property market, we expect prices to remain high, with some price increases, albeit not at the same rate as last year."

The December data from Land Registry's House Price Index shows that London remains the best performing property market in England and Wales. The average price of a home in the capital rose by 11.2% over the year to £403,972.
For the country as a whole prices rose by 4.4% which takes the average property value in England and Wales to £167,353. Repossession volumes decreased by 28 per cent in July 2013 to 1,187 compared with 1,645 in July 2012.
The most up-to-date figures available show that during October 2013 the number of completed house sales in England & Wales increased by 21 per cent to 71,929 compared with 59,213 in October 2012. The number of properties sold in England and Wales for over £1 million in October 2013 increased by 40 per cent to 913 from 651 in October 2012.
A detailed listing of properties sold recently in the area will be appearing in a forthcoming edition of the Fulham newsletter.
| Fulham Property Prices (October - December 2013) | ||||||||||
|---|---|---|---|---|---|---|---|---|---|---|
| Area | Detached | Sales | Semi-detached | Sales | Terrace | Sales | Flat/ mais |
Sales | Overall Ave |
Overall Sales |
| SW6 1 | - | - | - | - | 1500000 | 1 | 608458 | 25 | 642748 | 26 |
| SW6 2 | - | - | 850000 | 1 | 1219737 | 15 | 811129 | 63 | 889204 | 79 |
| SW6 3 | 1065000 | 1 | 3250000 | 1 | 1892550 | 10 | 696875 | 16 | 1228232 | 28 |
| SW6 4 | 4732500 | 1 | - | - | 1547751 | 15 | 616705 | 22 | 1092534 | 38 |
| SW6 5 | - | - | 2395000 | 1 | 1561111 | 9 | 546253 | 27 | 843076 | 37 |
| SW6 6 | - | - | 1970000 | 5 | 1244846 | 13 | 633569 | 36 | 904472 | 54 |
| SW6 7 | - | - | - | - | 1145114 | 22 | 508306 | 36 | 749854 | 58 |
| Total | 2898750 | 2 | 2043125 | 8 | 1380745 | 85 | 652828 | 225 | 894976 | 320 |
| Change over quarter | -21.6% | 14.3% | -12.0% | -37.5% | 4.1% | -17.0% | -7.6% | -22.9% | ||
| Change over year | 16.5% | 19.7% | 20.0% | 1.8% | 25.5% | 8.5% | ||||
| Change over three years | 38.0% | 2.4% | 59.0% | 51.0% | 39.9% | 36.2% | ||||
| Change over five years | - | - | - | - | 48.0% | - | ||||
| Change over ten years | - | - | - | - | 106.1% | - | ||||
| Fulham Property Prices (July - September 2013) | ||||||||||
|---|---|---|---|---|---|---|---|---|---|---|
| Area | Detached | Sales | Semi-detached | Sales | Terraced | Sales | Flat/ mais |
Sales | Overall Ave. | Overall Sales |
| SW6 1 | 0 | 0 | 0 | 0 | 1445003 | 6 | 547169 | 54 | 636952 | 60 |
| SW6 2 | 0 | 0 | 0 | 0 | 1242826 | 21 | 743666 | 56 | 879801 | 77 |
| SW6 3 | 0 | 0 | 3550000 | 1 | 2262875 | 32 | 829639 | 32 | 1577084 | 65 |
| SW6 4 | 0 | 0 | 0 | 0 | 1688643 | 21 | 576378 | 28 | 1053063 | 49 |
| SW6 5 | 710000 | 1 | 0 | 0 | 1651906 | 16 | 578111 | 18 | 1072757 | 35 |
| SW6 6 | 0 | 0 | 2449350 | 6 | 1338214 | 14 | 597451 | 53 | 891726 | 73 |
| SW6 7 | 0 | 0 | 0 | 0 | 980056 | 26 | 465861 | 30 | 704595 | 56 |
| Total | 710000 | 1 | 2606586 | 7 | 1568307 | 136 | 627034 | 271 | 969089 | 415 |
| Change over quarter | 138.0% | 600.0% | 6.8% | 17.2% | 1.6% | 36.9% | 4.0% | 31.7% | ||
| Change over year | - | - | 15.2% | -0.7% | 20.1% | 46.5% | 9.5% | 27.7% | ||
| Change over three years | 44.0% | -7.5% | 38.0% | 53.1% | 27.3% | 26.1% | ||||
| Change over five years | 30.3% | - | ||||||||
| Change over ten years | 123.4% | - | ||||||||
February 24, 2014
Related links
|