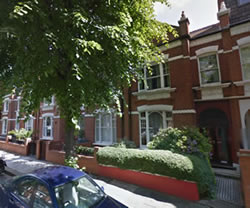
Fulham Property Prices Hit Yet Another All Time High
Including the most expensive terraced house ever sold at just under £4 million
Fulham property prices hit yet another all time high in the third quarter of 2013, with the average value creeping ever closer to the one million pound mark.
The average was £969,089, up 4% from the previous quarter when it reached £931,820.
Prices were up on all types of property, though flats and maisonettes showed only a small rise of 1.6% from £617,005 in the second quarter to £627,034.
Terraced houses leapt by 6.8% - just over £100,000 - from £1,467,771 to £1,568,307.
But it was the top of the market which showed the most astonishing rise, with the average price of a semi-detached house soaring by 138%, though the previous quarter was perhaps untypical with just one home changing hands for £1,095,020.
In this quarter it was a very different picture, with seven houses being sold and the average price reaching £2,606,586.
These sales included two houses in Chipstead Street in Parsons Green which were sold for just under £4 million. They become the 5th and 7th most expensive homes ever sold in the Fulham area with one, costing its new owners £3,950,000, becoming SW6's all time highest priced terraced house.
Sales were also booming during the period, with a total of 415 properties changing hands - up 100 on the previous total of 315.
Alex Lyle of estate agents Marsh and Parsons says that 2013 has been a fantastic year for the Fulham sales market. " Like the rest of prime London, Fulham continues to experience a staggering imbalance between supply and demand, with 28 buyers for each available property," he says.
" Every time a new record price is reached, it’s not long before it’s surpassed – to the astonishment of many. Of course, this is to the delight of local home-owners, but the despair of those buyers still trying to secure property.
" The creep of gentrification has spread through the streets, even to places most buyers entering the area would have cast a polite, 'thanks, but no thanks' just a few years ago. As the area becomes increasingly desirable, it attracts an even wealthier set of buyers with bigger budgets, which in turn has made Fulham one of the best performing property markets in London.
" This 'wealth spiral' is most certainly set to continue with only seasonal pauses for breath likely to impact market activity."

The September data from Land Registry's House Price Index shows that London remains the best performing property market in England and Wales. The average price of a home in the capital rose by 9.3% over the year to £393,462.
Jon Pishiri, RICS London residential spokesperson commented, “Increasing demand and continuing low supply are major determinants in London prices being pushed up. The Help to Buy initiative coupled with rising rental values are further encouraging people to purchase a house as opposed to renting. There is an obvious need to increase supply to the market in order to address this problem.”
For the country as a whole prices rose by 3.4% which takes the average property value in England and Wales to £167,063. Repossession volumes decreased by 28 per cent in July 2013 to 1,187 compared with 1,645 in July 2012.
The number of properties sold in England and Wales for over £1 million in July 2013 increased by 34 per cent to 1,143 from 852 in July 2012.
A detailed listing of properties sold recently in the area will be appearing in a forthcoming edition of the Fulham newsletter.
| Fulham Property Prices (July - September 2013) | ||||||||||
|---|---|---|---|---|---|---|---|---|---|---|
| Area | Detached | Sales | Semi-detached | Sales | Terraced | Sales | Flat/ mais |
Sales | Overall Ave. | Overall Sales |
| SW6 1 | 0 | 0 | 0 | 0 | 1445003 | 6 | 547169 | 54 | 636952 | 60 |
| SW6 2 | 0 | 0 | 0 | 0 | 1242826 | 21 | 743666 | 56 | 879801 | 77 |
| SW6 3 | 0 | 0 | 3550000 | 1 | 2262875 | 32 | 829639 | 32 | 1577084 | 65 |
| SW6 4 | 0 | 0 | 0 | 0 | 1688643 | 21 | 576378 | 28 | 1053063 | 49 |
| SW6 5 | 710000 | 1 | 0 | 0 | 1651906 | 16 | 578111 | 18 | 1072757 | 35 |
| SW6 6 | 0 | 0 | 2449350 | 6 | 1338214 | 14 | 597451 | 53 | 891726 | 73 |
| SW6 7 | 0 | 0 | 0 | 0 | 980056 | 26 | 465861 | 30 | 704595 | 56 |
| Total | 710000 | 1 | 2606586 | 7 | 1568307 | 136 | 627034 | 271 | 969089 | 415 |
| Change over quarter | - | - | 138.0% | 600.0% | 6.8% | 17.2% | 1.6% | 36.9% | 4.0% | 31.7% |
| Change over year | - | - | - | - | 15.2% | -0.7% | 20.1% | 46.5% | 9.5% | 27.7% |
| Change over three years | - | - | - | - | 44.0% | -7.5% | 38.0% | 53.1% | 27.3% | 26.1% |
| Change over five years | 30.3% | - | ||||||||
| Change over ten years | 123.4% | - | ||||||||
| Fulham Property Prices (April - June 2013) | ||||||||
|---|---|---|---|---|---|---|---|---|
| Area | Semi-Det | Sales | Terraced | Sales | Flat/Mais | Sales | Total Ave | Total Sales |
| SW6 1 | - | - | 1,172,857 | 7 | 507,235 | 17 | 701,375 | 24 |
| SW6 2 | - | - | 1,356,632 | 16 | 754,601 | 56 | 888,385 | 72 |
| SW6 3 | - | - | 2,095,155 | 20 | 732,181 | 16 | 1,489,389 | 36 |
| SW6 4 | - | - | 1,651,053 | 19 | 637,207 | 22 | 1,107,038 | 41 |
| SW6 5 | - | - | 1,535,565 | 17 | 511,450 | 25 | 925,973 | 42 |
| SW6 6 | - | - | 1,254,817 | 16 | 569,567 | 38 | 772,604 | 54 |
| SW6 7 | 1,095,000 | 1 | 994,786 | 21 | 463,463 | 24 | 719,752 | 46 |
| Total | 1,095,000 | 1 | 1,467,771 | 116 | 617,005 | 198 | 931,820 | 315 |
| Change over quarter | -59.9% |
-66.7% |
1.2% |
14.9% |
7.5% |
13.1% |
1.9% |
12.9% |
| Change over year | - |
- |
11.4% |
9.4% |
12.2% |
3.1% |
13.2% |
5.7% |
| Change over three years | - |
- |
35.0% |
8.4% |
32.3% |
11.9% |
33.1% |
10.9% |
| Change over five years | - |
- |
- |
- |
- |
- |
30.5% |
- |
| Change over ten years | - |
- |
- |
- |
- |
- |
122.1% |
- |
November 21, 2013
Related links
|