Less Than A Property A Day Being Sold In Fulham
Transactions tumble as buyers for top end homes disappear
The property market in Fulham remains in low gear, with prices of flats dropping and less than one sale per day being recorded.
The latest figures from the Land Registry show that there has been no recovery from the historically low levels of turnover seen over the last year. The data suggests that, if anything the situation is getting worse. Figures for April to June show a sharp fall compared with the same period last year but there may be more sales yet to be recorded for that quarter. However, in the first quarter of the year where the numbers will be finalised, turnover has collapsed by 40%
Though the overall average price in the second quarter of the year remained relatively stable, slipping marginally from £1,049,368 to £1,035,098, this was mainly because of a bounce back in the value of terraced houses.
Between January and March, the average price fell by 10.6% to £1,494,645. By contrast, it rose again during the next three month by 13.6% to reach £1,734,128.
It was a different picture for flats, with the average price - £745,476 - representing a fall of 8.8% over the previous quarter and 13.6% over a year.
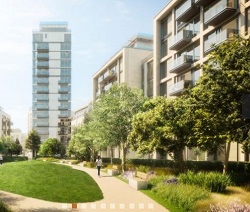
The reason for this continuing slide appears straightforward - the slump in the very top of the luxury flat market. Though some sales were recorded during the period at Fulham's new developments including Lillie Square and Chelsea Creek, the majority changed hands for under one million pounds - as did flats on the secondhand market.
This is very different to previous years, when buyers, including many from overseas, flocked to invest in flats worth £3 million and above.
Houses in this price bracket were also highly sought after, with many being sold to French and Italian families.
Our property listing shows that there are currently around 50 properties, both flats and houses, for sale in Fulham priced above the £3 million mark, but many have been on the market for months, and Inland Revenue figures show that no sales at all have been recorded in 2017 in this rarified price bracket.
Amidst continuing uncertainty caused by Brexit and the effects of Stamp Duty changes, it remains to be seen whether these investors will return.
Agent Marsh and Parsons' London Property Monitor for this quarter highlights this situation in what it calls Prime London, which includes Fulham, saying: "With the additional Stamp Duty levy targeted at second-home owners kicking in at the beginning of April, it was no surprise to see buy-to-let investors dominate the Prime London property landscape in the first quarter of 2016 as landlords raced to expand their portfolios before the additional charges kicked in.
"As such, it was expected that the portion of the market accounted for by property investors would fall in the second quarter of 2016, but this reduction has been even more marked than expected. Having accounted for more than a third (36%) of Prime London transactions in the first three months of the year, such purchases represented just 13% of sales in Q2."
The agent however, sees an upside with first time buyers making a comeback to the market. it said:" First-time buyers are now the most prolific buyers across all Prime London.
"Those taking their first step on the property ladder represented 22% of the market in quarter one, and this rose to 34% in Q2, making them the most common buyer type. This new lifeblood at the bottom of the supply process also freed logjams further up the chain and enabled upsizing activity to significantly increase. Having accounted for just 9% of transactions in Q1 2016, second steppers and those moving to larger properties represented 22% of sales in Q2."

Political uncertainty and the aftermath of tax changes are the obstacles hindering the London housing market, according to the latest RICS UK Residential Market Survey. This July, the surveyors’ organisation’s headline price growth indicator in London slipped from a net balance of -45% to -48%, continuing a run of consecutive negative readings since March 2016. When surveyors were asked about prices at the top end of the market (properties listed at over £1 million) they reported that this sector was seeing the greatest deviation in agreed prices, with 68% of respondents reporting sales prices coming in below the asking price. Whilst the RICS say this is not uncommon in a flatter market, 33% of respondents said the agreed price was up to 5% below the asking price and 26% reported between 5% and 10% under.
Looking ahead, London near term price expectations among surveyors continue to signal a declining trend over the coming three months, the eighth consecutive reported negative reading. Over the next twelve months, respondents in central London are now anticipating a decline in prices.
Alongside this, the capital’s sales activity continues to lack momentum, with the net balance readings for buyer enquiries and agreed sales remaining slightly negative, at -9% and -13%, respectively. Respondents are not anticipating activity in the sales market to gain impetus, with both the three and twelve month expectations series slightly negative.
In the lettings market, London rents are predicted to remain in decline, which has been, a trend present over the last six quarters.
Simon Rubinsohn, RICS Chief Economist, commented, “Sales activity in the housing market has been slipping in the recent months and the most worrying aspect of the latest survey is the suggestion that this could continue for some time to come. One reason for this is the recent series of tax changes but this is only part of the story. Lack of new build in the wake of the financial crisis is a more fundamental factor weighing on the market. And there are some very real consequences for the economy from all of this including the impact on the ability of people to be mobile when looking for work. The flatter trend in price growth is arguably a silver lining but there is no real indication that the housing market will become materially more affordable anytime soon.”
Updates on the local property market are regularly published in the Fulham newsletter.
| Fulham Property Prices (April - June 2017) | ||||||||||
|---|---|---|---|---|---|---|---|---|---|---|
| Area | Detached | Sales | Semi-det | Sales | Terraced | Sales | Flat/ mais |
Sales | Overall ave | Total sales |
| SW6 1 | 1625000 | 1 | 1328750 | 2 | 0 | 0 | 791089 | 14 | 903397 | 17 |
| SW6 2 | 0 | 0 | 1600000 | 1 | 1361025 | 3 | 857406 | 24 | 937887 | 28 |
| SW6 3 | 0 | 0 | 1450000 | 1 | 2818750 | 4 | 653781 | 8 | 1381173 | 13 |
| SW6 4 | 0 | 0 | 0 | 0 | 1455833 | 3 | 659230 | 10 | 843062 | 13 |
| SW6 5 | 0 | 0 | 0 | 0 | 2125000 | 2 | 521167 | 3 | 1162700 | 5 |
| SW6 6 | 2475000 | 1 | 0 | 0 | 1645000 | 8 | 712882 | 17 | 1067462 | 26 |
| SW6 7 | 0 | 0 | 0 | 0 | 1427500 | 8 | 620000 | 4 | 1158333 | 12 |
| Total | 2050000 | 2 | 1426875 | 4 | 1734128 | 28 | 745476 | 80 | 1035098 | 114 |
| Change over quarter | - | - | -39.0% | -20.0% | 13.6% | -39.1% | -8.8% | -42.9% | 0.7% | -40.3% |
| Change over year | - | - | -47.6% | 33.3% | -1.9% | -40.4% | -13.6% | -55.8% | -3.4% | -50.6% |
| Change over three years | - | - | -39.4% | -33.3% | 6.2% | -65.9% | 5.6% | -57.4% | -4.1% | -59.0% |
| Change over five years | - | - | - | - | 31.6% | -73.6% | 35.5% | -58.3% | 25.7% | -61.7% |
| Change over ten years | - | - | 27.3% | -50.0% | 78.5% | -82.8% | 79.7% | -76.3% | 71.5% | -77.6% |
August 25, 2017
Related links
|
 Lillie Square