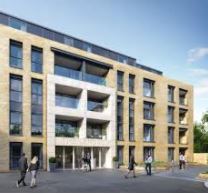
Fulham's Luxury New Apartments Fail to Find Buyers
Overall average price once again dragged by lack of transactions
There appears to be something of a buyers' strike in the Fulham area as far as flats in the area are concerned.
So far this year the average price of flats in Fulham fell sharply to £749,403 down 22% from the final quarter of 2016.
This precipitous drop is due to a single factor - the lack of sales of multi-million pound luxury apartments in SW6's most upmarket new developments.
In the previous quarter, four sales were recorded in the tower at Chelsea Creek, with price tags of between £2,520,000 and £2,800,000.
Between January and March this year, just one new apartment in Fulham - at the Landau Apartments in Farm Lane - changed hands for just over the million mark at £1,050,000. And at other developments such as Lillie Square, no sales at all were recorded.
These statistics accord with a report from Rightmove, which found that our borough is among the five worst performing in London, with the top of the ladder suffering the most.
Rightmove director Miles Shipside says: "While the rest of the country enjoys a spring surge with most regions seeing a price boom and new price records, some parts of the London market are still re-adjusting.
"Demand for housing in the mass lower and middle sectors remains strong, with buyers looking for homes to get them on the ladder or meet the needs of a growing family. The more discretionary upper end of the market is having to tempt buyers with cheaper asking prices, off-setting the higher purchase taxes in this sector."
The new figures from the Land Registry bear this out, showing that the market for terraced homes remains brisk, with 38 sales recorded during this period, though these prices are also "re-adjusting", down 10.6% to £1,494,645. And though the most expensive new apartments in developments such as Chelsea Creek are failing to sell, there were three sales of lower priced apartments with price tags of between £495,000 and £780,000.
The drought at the top of the market dragged the overall average price in Fulham down to £1,064,741 - a fall of 8.4% over the quarter and 6.8% over the year.
But while this may sound like bad news, more "realistic" prices are helping to bring back the sellers this spring, according to James Sims, sales director at local agent Brik. He sees he market is picking up across all price ranges, particularly in the sub-£1 million bracket where stamp duty rates are lower.
And he adds: "Most buyers are taking a minimum ten year view with their acquisitions, as they acknowledge that life must go on, despite economic and political challenges."
Meanwhile Simon Rubinsohn, RICS Chief Economist sees the lettings market as being stronger than the sales side. He said, "It is noticeable that the amount of new rental instructions coming through to agents is continuing to edge lower, which is not altogether surprising given the changing landscape for buy-to-let investors. One consequence of this is that rents are expected to continue rising not just in the near term but also further out and at a faster pace than house prices."
During March 2017 London was the worst performing region of the country according to the Land Registry with prices falling by 1.5% from the previous month to £471,742. Over the course of the last twelve months prices have risen by 1.5%.
For England as a whole prices are up by 4.4% in the year to March rising to an average of £232,530.
The number of completed house sales in London in January, the latest month for which figures are available, fell by 26.3% to 5,968 compared with 8,093 in January 2016.
A detailed listing of properties sold recently in the area will be appearing in a forthcoming edition of the Fulham newsletter.
Fulham Property Prices (January - March 2017) |
||||||||
|---|---|---|---|---|---|---|---|---|
Area |
Semi-det |
Sales |
Terraced |
Sales |
Flat/ mais |
Sales |
Overall ave |
Total sales |
| SW6 1 | 0 | 0 | 1521168 | 3 | 841667 | 3 | 1181417 | 6 |
| SW6 2 | 0 | 0 | 1158750 | 6 | 758227 | 22 | 844054 | 28 |
| SW6 3 | 3000000 | 1 | 1804286 | 7 | 905731 | 8 | 1429741 | 16 |
| SW6 4 | 0 | 0 | 1960000 | 4 | 919778 | 9 | 1239846 | 13 |
| SW6 5 | 0 | 0 | 1584500 | 5 | 638075 | 8 | 1002085 | 13 |
| SW6 6 | 2562500 | 2 | 1421857 | 7 | 777800 | 15 | 1114375 | 24 |
| SW6 7 | 0 | 0 | 1155833 | 6 | 400625 | 8 | 724286 | 14 |
| Total | 2708333 | 3 | 1494645 | 38 | 749403 | 73 | 1049368 | 114 |
| Change over quarter | 76.6% | 0.0% | -10.6% | -19.1% | -22.0% | -42.1% | -10.2% | -36.0% |
| Change over year | -23.4% | 50.0% | -19.7% | -55.3% | -7.8% | -69.5% | -5.2% | -65.2% |
| Change over three years | -5.2% | -57.1% | -7.4% | -62.4% | 15.9% | -61.8% | 1.3% | -62.0% |
| Change over five years | - | - | 26.5% | -56.3% | 63.8% | -59.4% | 51.4% | -57.3% |
| Change over ten years | 197.9% | -80.0% | 76.7% | -72.1% | 72.9% | -76.4% | 83.2% | -75.3% |
May 19, 2017
Related links
|
