Average Fulham Property Price Slips as Sales Slow in Winter
But latest figures also show flat values rising to all time high
The overall average price of property in SW6 slipped in the final quarter of 2014 - but still remained well above the one million pound mark.
The 5.8% drop, which saw the average fall from
£1,180,367 reached between July and September to £1,111,938 between October and December, was mainly driven by the annual slow down in sales in the run-up to Christmas, which saw the overall number of properties changing hands fall from 292 to 250.
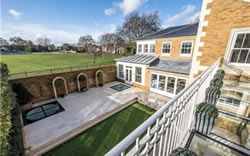
At the top end of the market, two of Fulham's grandest detached homes found new owners, including New Lodge in Broomhouse Lane, a six bedroomed house with its own swimming pool, spa and cinema overlooking Hurlingham Park.
It fetched £12,000,000, making it Fulham's second most expensive home, though that fell short of its original sale price of £16,000,000.
Two semi-detached homes also changed hands, along with 64 terraced houses which achieved an average price of £1,774,456, a drop of 8.5% on the previous peak of £1,939,257.
The price of flats however, is continuing to rise, up in this quarter by a relatively modest 3.6% from £749,324 to £775,958.
This rise is mainly fuelled by new developments such as Fulham Riverside, where one bedroom apartments are currently priced from £685,000 to £810,000 and the even more expensive Chelsea Creek, where the price of one bedroom flats begins at £889,950.
And though the property picture in this quarter may seem somewhat mixed, the figures show that over the last year, the overall average has risen by 29.3%, while over the last ten years, it has almost doubled, climbing by 94.4%.
This long term rise, says local estate agent Allan Fuller shows that home ownership has been proven conclusively to be the best long term financial decision that most of us will ever make. " The rise not be a constant curve, in fact there may be times values dip if there is a severe recession, but then they bounce back," he says.
" In 2007 for example, London values reached a peak, by the end of 2008 there had been an average decline of between 10% to 20%, but this was clawed back during the following years as interest rates tumbled and now values are way ahead of the 2007 levels."
London continues to be the area of the country seeing the strongest price growth. During December the average price in the capital was £464,936 up another 1.8% compared to the previous month to bring the annual price rise to 16.8%
The December data shows a monthly price increase of 0.6 % bringing the annual price change to 7.0% and the average house price in England and Wales to £177,766.
The number of property transactions has increased over the last year. From July 2013 to October 2013 there was an average of 75,201 sales per month compared to 82,067 for the same period in 2014.
Simon Rubinsohn, RICS Chief Economist, said, 'Despite the slowdown, there is optimism that the stamp duty reforms will deliver a 2-5% boost in both sales and prices over the next 12 months, despite members in London expecting sales to decrease by between 5-10% and prices to decrease by 2-5%, with larger properties and/or those in prime areas expected to see the biggest price decreases.'
A detailed listing of properties sold recently in the area will be appearing in a forthcoming edition of the Fulham newsletter.
| Fulham Property Prices (October - December 2014) | ||||||||||
|---|---|---|---|---|---|---|---|---|---|---|
| Area | Detached | Sales | Semi-Det | Sales | Terraced | Sales | Flats/ Mais |
Sales | Overall Ave | Total Sales |
| SW6 1 | 5200000 | 1 | 1995000 | 1 | 3096250 | 12 | 1670925 | 14 | 2419391 | 28 |
| SW6 2 | 0 | 0 | 0 | 0 | 1408856 | 13 | 786074 | 61 | 895481 | 74 |
| SW6 3 | 12000000 | 1 | 0 | 0 | 1477000 | 5 | 827346 | 13 | 1586342 | 19 |
| SW6 4 | 0 | 0 | 0 | 0 | 1999857 | 7 | 561189 | 20 | 934177 | 27 |
| SW6 5 | 0 | 0 | 0 | 0 | 1871429 | 7 | 666141 | 24 | 938303 | 31 |
| SW6 6 | 0 | 0 | 3999950 | 1 | 1351250 | 4 | 688976 | 29 | 864272 | 34 |
| SW6 7 | 0 | 0 | 0 | 0 | 1137878 | 16 | 568286 | 21 | 814596 | 37 |
| Total | 8600000 | 2 | 2997475 | 2 | 1774456 | 64 | 775958 | 182 | 1111938 | 250 |
| Change over quarter | 24.9% | 0.0% | -8.5% | -37.9% | 3.6% | -2.7% | -5.8% | -14.4% | ||
| Change over year | 46.7% | -75.0% | 28.5% | -24.7% | 21.6% | -30.0% | 29.3% | -29.6% | ||
| Change over three years | - | - | 56.3% | -39.6% | 71.5% | -3.7% | 59.3% | -15.3% | ||
| Change over five years | 106.9% | -66.7% | 87.9% | -46.7% | 77.6% | 22.1% | 63.4% | -9.1% | ||
| Change over ten years | 94.4% | - | ||||||||
February 19, 2015
Related links
|

