Property Prices in Fulham Break New Records
Flats and terraced houses at all time high and £18 million house sale
Fulham property prices soared to new levels in the second quarter of 2014, with the average price of flats and terraced houses at an all time high and one house in Seagrave Road selling for an amazing £18,000,000.
The average flat price in SW6 broke through the £700,000 mark, rising by 9.1% from £646,795 in the first three months of the year of 2013 to a new high of £705,746.
Terraced houses saw a more modest rise of 1.1%, climbing from £1,614,349 to £1,632,283.
The value of semi-detached houses slipped by 17.5% to £2,355,965 from £2,856,421, but that figure was an all time high and a leap of 39.8% from the previous three months.
The average property price in Fulham is now £1,079,310, up 4.2% from the last quarter, when the average rose above one million for the first time to reach £1,035,607.
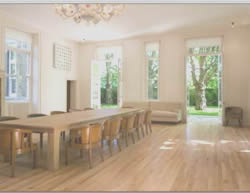
One property meanwhile, Lily Bridge House at 202 Seagrave Road, next to London Oratory School, changed hands in spring for £18,000,000.
The property, which was previously available for rent, was described by the agent as "a stunning country home right in the heart of south-west London spectacularly positioned in two thirds of an acre of garden."
The "vast" house, with separate staff quarters and a long private driveway, comprises seven bedrooms, four reception rooms, eight bathrooms and extensive parking all contributing to an unparalleled entertaining space.
This house is one of several properties which have recently gone on the market in Fulham with price tags above £15 million - others include the penthouse at Chelsea Creek which is for sale at £17 million and a newly built house in Broomhouse Lane priced £16 million.
The average price in London during the month of June was £437,608 which is up by 16.4% compared with the same month in 2013. For England and Wales as a whole the average is now £172,011 compared with the peak of £181,466 in November 2007 up by 6.4%.
The most up-to-date figures available show that during April 2014 the number of completed house sales in England & Wales increased by 31 per cent to 66,659 compared with 51,022 in April 2013.
The number of properties sold in England and Wales for over £1 million in April 2014 increased by 39 per cent to 1,028 from 740 in April 2013.
A detailed listing of properties sold recently in the area will be appearing in a forthcoming edition of the Fulham newsletter.
| Fulham Property Prices (April - June 2014) | ||||||||||
|---|---|---|---|---|---|---|---|---|---|---|
| Area | Detached | Sales | Semi-detached | Sales | Terraced | Sales | Flat/ mais |
Sales | Overall Ave | Overall Sales |
| SW6 1 | 18000000 | 1 | 0 | 0 | 2240000 | 5 | 628719 | 27 | 1399255 | 33 |
| SW6 2 | 0 | 0 | 0 | 0 | 1523813 | 15 | 835274 | 50 | 994168 | 65 |
| SW6 3 | 0 | 0 | 875000 | 1 | 2311692 | 13 | 725682 | 15 | 1441801 | 29 |
| SW6 4 | 1385000 | 1 | 2580394 | 2 | 1671125 | 8 | 596455 | 19 | 1041581 | 30 |
| SW6 5 | 0 | 0 | 2300000 | 1 | 1679583 | 12 | 614689 | 20 | 1052994 | 33 |
| SW6 6 | 0 | 0 | 2900000 | 2 | 1338990 | 10 | 689414 | 32 | 937526 | 44 |
| SW6 7 | 0 | 0 | 0 | 0 | 1201268 | 19 | 694728 | 25 | 913461 | 44 |
| Total | 9692500 | 2 | 2355965 | 6 | 1632283 | 82 | 705746 | 188 | 1079310 | 278 |
| Change over quarter | 136.4% | 100.0% | -17.5% | -14.3% | 1.1% | -18.8% | 9.1% | -1.6% | 4.2% | -7.3% |
| Change over year | 115.2% | 500.0% | 11.2% | -29.3% | 14.4% | -5.1% | 15.8% | -11.7% | ||
| Change over three years | 15.4% | 20.0% | 35.1% | -25.5% | 38.1% | 0.0% | 36.7% | -8.3% | ||
| Change over five years | 318.2% | 0.0% | 111.2% | 10.8% | 72.2% | 97.9% | 89.8% | 58.9% | ||
| Change over ten years | 128.7% | - | ||||||||
August 15, 2014
Related links
|

