Fulham Property Prices Reach All Time High
Average at top end of market above the £2 million barrier
House prices in Fulham hit an all time high in the first three months of 2011, with the average jumping by 20.9% to reach £773,060, compared with £639,597 in the previous quarter.
All sections of the market rose, though the biggest leap was in terraced houses, which were up a spectacular 24.4%, from £1,000,819 between October and December to £1,245,015 from January to March.
Semi-detached houses climbed by a more modest £2,093,000 while flats were up 3.2%, reaching £433,682.
The volume of properties changing hands brought more good news for local estate agents, with a rise of 10% from 235 to 259.
Properties in London are now the only ones in the country that have risen compared with the same period last year. The Land Registry's House Price Index shows that the average price in the capital was £336,828 in March 2011, up by 0.8% compared to the same month last year.
For England and Wales the average price is now £160,996, down by 2.3% from March 2010. Prices in the north east have fallen by 9.3% and in Wales they are down by 7.2%.
Sales Price Map for West and South West London
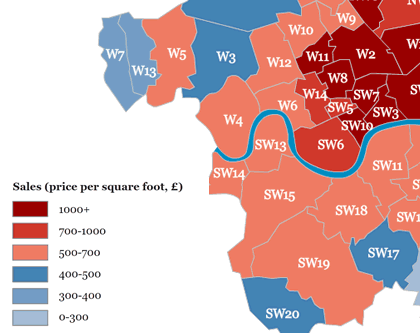
Source: Jones Lang LaSalle/Financial Times
Meanwhile a new report states that the price per square foot of property in Fulham is £702 with an annual rental of £32.87 psf giving a yield of 4.68%
In Hammersmith yields have fallen as capital values have moved up more quickly than rents, with analysts saying this is due to the area moving to full 'gentrification'.
| Area | Sale Price per sq ft | Rental Price per sq ft | Yield |
|---|---|---|---|
| Fulham | 702 |
32.87 |
4.68 |
| Chiswick | 599 |
30.07 |
5.02 |
| Acton | 440 |
23.40 |
4.02 |
| Ealing (W5) | 503 |
20.74 |
4.10 |
| Ealing (W13) | 393 |
22.42 |
5.48 |
| Hammersmith | 622 |
25.97 |
4.18 |
| Shepherd's Bush | 539 |
n/a |
n/a |
| Putney | 565 |
21.70 |
n/a |
| Barnes | 570 |
n/a |
n/a |
| Wandsworth | 560 |
31.46 |
5.62 |
Source: Jones Lang LaSalle/Financial Times
Fulham Property Prices -January - March 2011
| Area | Semi-Det | Sales | Terraced | Sales | Flat/Mais | Sales | Total Ave | Total Sales |
|---|---|---|---|---|---|---|---|---|
| SW6 1 | 0 | 0 | 1304000 | 5 | 314827 | 9 | 668103 | 14 |
| SW6 2 | 0 | 0 | 807500 | 9 | 435428 | 64 | 481300 | 73 |
| SW6 3 | 0 | 0 | 1725126 | 24 | 528350 | 10 | 1373133 | 34 |
| SW6 4 | 0 | 0 | 1571125 | 14 | 389950 | 20 | 876316 | 34 |
| SW6 5 | 0 | 0 | 1195833 | 9 | 448214 | 21 | 672500 | 30 |
| SW6 6 | 2093000 | 5 | 1072555 | 18 | 434563 | 19 | 905421 | 42 |
| SW6 7 | 0 | 0 | 821704 | 21 | 344954 | 11 | 657821 | 32 |
| Total | 2093000 | 5 | 1245105 | 100 | 423682 | 154 | 773060 | 259 |
| Change over quarter | 3.7% | 66.7% | 24.4% | 20.5% | 3.2% | 3.4% | 20.9% | 10.2% |
| Change over year | - | - | 13.9% | 1.0% | -5.3% | 14.9% | 7.1% | 11.2% |
| Change over three years | - | 103.5% | - | |||||
| Change over five years | - | 48.8% | - | |||||
| Change over ten years | - | 113.6% | - | |||||
Fulham Property Prices - October - December 2010
| Area | Semi-Det | Sales | Terraced | Sales | Flat/Mais | Sales | Total Averages | Total Sales |
|---|---|---|---|---|---|---|---|---|
| SW6 1 | 0 | 0 | 802833 | 3 | 402772 | 11 | 488499 | 14 |
| SW6 2 | 0 | 0 | 899954 | 11 | 365427 | 42 | 476367 | 53 |
| SW6 3 | 0 | 0 | 1115366 | 17 | 585727 | 11 | 907294 | 28 |
| SW6 4 | 0 | 0 | 1296550 | 10 | 418881 | 14 | 784576 | 24 |
| SW6 5 | 0 | 0 | 989651 | 12 | 426406 | 16 | 667797 | 28 |
| SW6 6 | 2017666 | 3 | 928566 | 15 | 413446 | 34 | 654589 | 52 |
| SW6 7 | 0 | 0 | 868600 | 15 | 391372 | 21 | 590217 | 36 |
| Total | 2017666 | 3 | 1000819 | 83 | 410632 | 149 | 639597 | 235 |
| Change over quarter | - | - | -8.1% | -43.5% | -9.6% | -15.8% | -16.0% | -28.6% |
| Change over year | - | - | 6.0% | -30.8% | -6.0% | 0.0% | -6.0% | -14.5% |
| Change over three years | -6.9% | - | ||||||
| Change over five years | 29.6% | - | ||||||
| Change over ten years | 80.9% | - | ||||||
May 27, 2011
