Second Highest Price Ever Paid For W12 House
Palgrave Road property leads robust market in million pound plus family homes

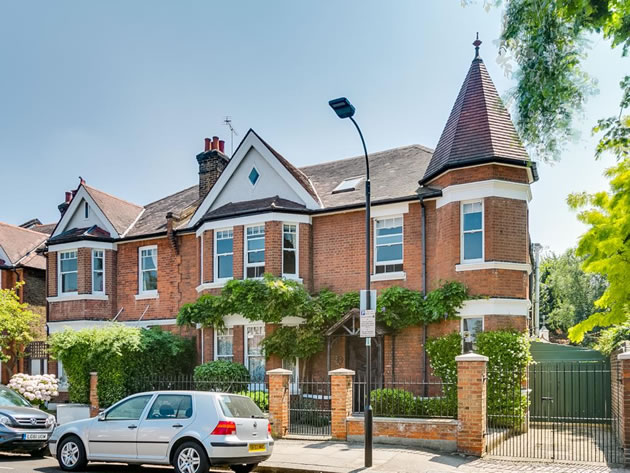
House in Palgrave Road went for £3,650,000
A six bedroom semi-detached property in Palgrave Road, close to Stamford Brook, recently achieved the second highest ever price for a house in W12 when it sold for £3,650,000.
Only one house in nearby Hartswood Road - also with six bedrooms - was more expensive, changing hands for £3,700,000 back in January 2016.
W12's highest ever priced property meanwhile remains an apartment at Television centre in Wood Lane, which sold last October for just under the five million mark at £4,964,841.
The latest figures from the Land Registry show there is a continuing demand for properties in the price bracket around the Shepherd's Bush area, with a sizeable number of million pound plus sales. And while a handful were flats in the perennially popular Television Centre - the redevelopment of the iconic former home of the BBC - the majority were of family homes in highly sought after streets such as Ormiston Grove and Emlyn Road, where one house changed hands for £2,750,000.
These high prices helped to push up the overall average in Shepherd's Bush to £895,830 - up a small percentage both on the previous quarter and the same period in 2018.
However, this period between January and March is always quiet and estate agents will now be hoping this positive trend continues in spring, as more properties come onto the market.
The overall rise came despite the fact that the average price of flats showed a large drop, partly due to fewer sales in this quarter of new apartments at local upmarket developments, but also due to first timers and younger buyers seeking out homes at bargain prices in areas like the White City Estate and around the town centre.
These included a flat in Melville Court in Goldhawk Road, which sold for £295,000 and another in Mayfield Road which fetched £280,000.
As the weather heats up, local estate Kerr & Co are striking an optimistic note, saying that with the delay of Brexit, they are seeing 'market sentiment' improve. They add: " A steady line of enquiries from home owners especially from the family market have been an encouraging sign that many families are looking to secure a long term home where they are able to put down firm roots.
"School places and ease of access to a chosen school weighs so choosing a new home with these considerations in mind seems to be the main issues concerning those looking to move.
"With attractive mortgage rates and first time buyer tax relief there has also been a resurgence of first time buyers looking to secure their first home."
The Nationwide's House Price Index showed that London had the fastest pace of decline in the UK in the first quarter of 2019 with prices down by 3.8% compared with the same period in 2018 averaging £455,594. This is the steepest fall for the area since 2009 and the seventh consecutive quarter in which prices have declined. The Nationwide's analysts say this partly reflects the level of price outperformance previously seen in the capital and the impact of policy changes on the Buy to Let market which has had a bigger effect on London because the private rental sector accounts for a larger proportion of the housing stock than elsewhere in the country.
Commenting on the figures, Robert Gardner, Nationwide's Chief Economist, said, “UK house price growth remained subdued in March, with prices just 0.7% higher than the same month last year.
“Indicators of housing market activity, such as the number of property transactions and the number of mortgages approved for house purchase, have remained broadly stable in recent months, even though survey data suggests that sentiment has softened.
“Measures of consumer confidence weakened around the turn of the year and surveyors report that new buyer enquiries have continued to decline, falling to their lowest level since 2008 in February.”
The March 2019 RICS UK Residential Survey results show little departure from the subdued picture evident across the sales market for several months now. They say forward looking indicators suggest this lack of momentum is likely to continue for a while longer, although perceptions on the twelve month outlook are a little more sanguine. However London and the South East continue to display the weakest sentiment in terms of prices.
The numbers below are subject to revision as is it usual that some properties are added late to the Land Registry's database.
| Shepherd's Bush Property Prices (January - March 2019) | ||||||||
|---|---|---|---|---|---|---|---|---|
| Area | Semi-detached | Sales | Terraced | Sales | Flat/ mais |
Sales | Overall Ave | Overall Sales |
| W12 0 | 0 | 0 | 1710000 | 1 | 492200 | 5 | 695167 | 6 |
| W12 7 | 0 | 0 | 826667 | 3 | 640675 | 9 | 687173 | 12 |
| W12 8 | 0 | 0 | 1760000 | 1 | 495564 | 7 | 653618 | 8 |
| W12 9 | 2317500 | 4 | 1665000 | 4 | 450429 | 7 | 1272200 | 15 |
| Total | 2317500 | 4 | 1401111 | 9 | 530322 | 28 | 895830 | 41 |
| Change over quarter | 255.2% | 100.0% | 37.4% | -52.6% | -37.7% | -69.6% | 2.2% | -63.7% |
| Change over year | 172.6% | 100.0% | 34.3% | -59.1% | -36.5% | -80.1% | 3.8% | -75.2% |
| Change over three years | 56.4% | -55.6% | 24.2% | -70.0% | -1.0% | -76.5% | 27.6% | -74.1% |
| Change over five years | 76.6% | 33.3% | 77.0% | -78.0% | 29.7% | -65.9% | 61.4% | -67.5% |
| Change over ten years | - | - | 283.9% | 28.6% | 89.2% | 27.3% | 157.0% | 13.9% |
Source: Land Registry
May 13, 2019

