Shepherd's Bush Becomes Hotspot for First Time Buyers
Agent says stamp duty changes are helping local young adults onto the property ladder
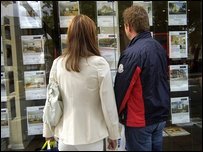
Shepherd's Bush is becoming an increasingly popular location for first time buyers, according to local estate agent Kerr & Co.
The agent says,"Our sales office have noticed a steady increase in the first-time buyer registrations since the beginning of the year compared to the same period last year."
One of the main reasons, the agent says, was the abolition of Stamp Duty for first-time buyers on the first £300,000 of the property price. " The stamp duty changes introduced last year have enabled more young adults, who have worked hard and saved a significant deposit, able to get on the property ladder.
"This came as a real boost for those who have dreamt about owning their own home."
The latest figures from the Land Registry bear this out. The market overall during the wintry first three months of 2018 remained subdued, down by around a half on both the previous quarter and on the same period one year ago, with just two semi-detached houses sold and no sales recorded of apartments in W12's upmarket new developments.
Sales of terraced houses were also down by around a half, with the average price slipping by 10.1%, dropping under the million pound mark to £967,794.
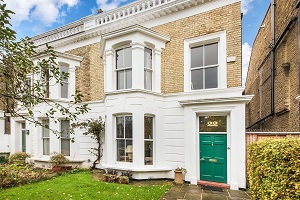
The most expensive sale in the first quarter was a five bedroomed terraced house in Ashchurch Park Villas, pictured below, which fetched £2,150,000.
However, the vast majority of properties changing hands during the period were flats, around a half of which were priced under £400,000, and five were under the stamp duty threshold of £300,000.
This shift in the balance of sales to affordable flats meant the overall average priced was £696, 542 - a fall of 8.9% from the previous quarter.
However, this average was still up 6.5% over the year, and 39.3% over five years - showing that in the long term, Shepherd's Bush remains a great place to invest.

According to the Nationwide House Price Index, property values in London as a whole fell by 1% in March compared with the same month last year. For the UK overall prices are up by 2.1% and the gap between the capital and the rest of the country has been slowly reduced over the last few months.
Commenting on the figures, Robert Gardner, Nationwide's Chief Economist, said: “Looking ahead, much will depend on how broader economic conditions evolve, especially in the labour market,
but also with respect to interest rates. Subdued economic activity and the ongoing squeeze on household budgets is likely to continue to exert a modest drag on housing market activity and house price growth this year."
Home ownership rates have declined across all English regions over the past decade. While the decline has been fairly uniform across regions, the biggest reduction has been in London, where the home ownership rate has fallen from 57% to 47%. The counterpart to this has been robust growth in the private rental sector; for example, 30% of households in London now rent.
The RICs say that their surveyor members report on balance an expectation of no price rises over the next 12 months representing the joint lowest reading since February 2013. Regionally, there continues to be significant variation in the house price indicator. London, exhibits the weakest feedback, with a net balance of -47% of respondents citing further price declines.
The numbers below are subject to revision as is it usual that some properties are added late to the Land Registry's database.
| Shepherd's Bush Property Prices (January - March 2018) | ||||||||
|---|---|---|---|---|---|---|---|---|
| Area | Semi-detached | Sales | Terraced | Sales | Flat/ mais |
Sales | Overall Ave | Overall Sales |
| W12 0 | 850000 | 2 | 648929 | 7 | 400000 | 1 | 664250 | 10 |
| W12 7 | 0 | 0 | 712500 | 2 | 469165 | 5 | 538689 | 7 |
| W12 8 | 0 | 0 | 1375000 | 1 | 433222 | 9 | 527400 | 10 |
| W12 9 | 0 | 0 | 1301429 | 7 | 572662 | 9 | 891497 | 16 |
| Total | 850000 | 2 | 967794 | 17 | 491616 | 24 | 696542 | 43 |
| Change over quarter | -45.1% | -50.0% | -10.1% | -46.9% | -2.1% | -56.4% | -8.9% | -53.3% |
| Change over year | -49.1% | 0.0% | -7.1% | 6.3% | -6.1% | -61.9% | 6.5% | -46.9% |
| Change over three years | -22.1% | 0.0% | 2.6% | -15.0% | -2.7% | -62.5% | 12.2% | -50.0% |
| Change over five years | - | - | 28.8% | -63.0% | 39.8% | -69.2% | 39.3% | -65.3% |
| Change over ten years | -31.7% | -50.0% | 58.9% | -29.2% | 66.9% | -66.2% | 70.2% | -56.6% |
Source: Land Registry
May 14, 2018
Related links
|