SW15 Flat Sales Have Second Worst Ever Quarter
Buyers still willing to pay up for large family homes
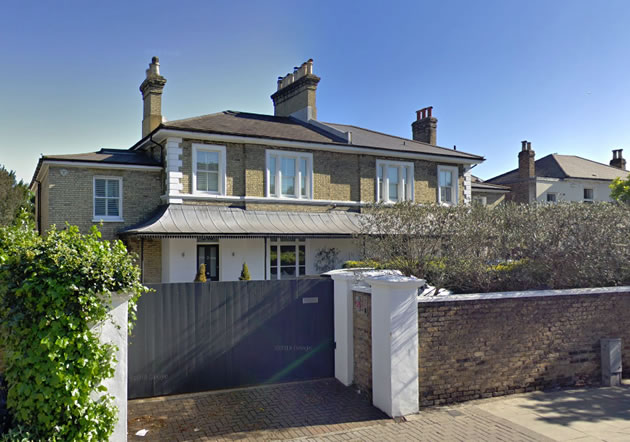
The 'Nelson House' on Upper Richmond Road went for £3,550,000. Picture: Google Streetview
The latest figures show that sales of flats in the SW15 postcode have only ever been lower at the height of the financial crisis in 2009.
There were just 60 sales of flats and apartments transacted in the second quarter of the year according to the Land Registry with just three of those new build units. Although more sales may be reported, this looks set to be the second quietest three months for flats since the agency started publishing figures.
One local estate agent told us, "Other than the obvious excuse of Brexit, there are a number of reasons this sector is being hit particularly hard in Putney. A lot of the stock is above the threshold for Help to Buy, buy to let investors have disappeared and so have overseas buyers as they are worried about currency weakness. Things may be set to get even worse because Boris Johnson is actively floating the idea of raising the stamp duty threshold. Until he actually goes ahead and does it, people are going to hold off transacting but the move would leave a £3.8billion hole in public finances so it may not actually happen."
Overall the average price of a home sold in Putney and Roehampton between April and June this year was £753,717 a 3.1% increase over the same three months in 2018.
Part of the reason for the resilience of the market overall is continuing demand for large family houses. Five properties for over £2,000,000 including ones on Dryburgh Road, Oxford Road and Dover Park Drive.
The highest priced sale was for the 6 bedroom '‘Nelson’s House' on the Upper Richmond Road which changed hands for £3,550,000. The Nelson Houses were developed in the 19th Century by Robert Pettiward who married the great niece of Admiral Nelson and named them in his honour. The house that was sold was also known as Rokeby Villa and was built in 1869 and now boasts a spectacular, landscaped and designed garden. It also has a family room/playroom, study, cinema room and gym.

According to the Nationwide House Price Index the average sale price in London was £465,722 down by 3.8% in the second quarter compared to the previous three months. Over the last year prices are down by 0.7% This is the eighth consecutive quarterly decline for London in a row. Moreover, prices in the capital are still only around 5% below the all-time highs recorded on Q1 2017 and c50% above their 2007 levels (by comparison, UK prices are only around 17% higher over the same period).
For the UK as a whole the average sale price was up by 0.4% over the last year to £215,910 with Northern Ireland seeing the strongest performance.
Commenting on the figures, Robert Gardner, Nationwide's Chief Economist, said, “Survey data suggests that new buyer enquiries and consumer confidence have remained subdued in recent months. Nevertheless, indicators of housing market activity, such as the number of mortgages approved for house purchase, have remained broadly stable.
“Housing market trends are likely to continue to mirror developments in the broader economy. While healthy labour market conditions and low borrowing costs will provide underlying support, uncertainty is likely to continue to act as a drag on sentiment and activity, with price growth and transaction levels remaining close to current levels over the coming months.”
The RICS UK Residential Market Survey for the second quarter concluded, “Although anecdotal commentary from respondents remains generally a little downbeat, contributors reported a rise in buyer demand, that new instructions have held steady, and that newly agreed sales also edged into positive territory for the first time in twenty-eight months.”
| Putney Property Prices (April - June 2019) | ||||||||||
|---|---|---|---|---|---|---|---|---|---|---|
Area |
Detached |
Sales |
Semi-detached |
Sales |
Terrace |
Sales |
Flat/ mais |
Sales |
Overall Ave |
Overall Sales |
| SW15 1 | 0 | 0 | 1925000 | 2 | 1326689 | 10 | 649328 | 9 | 1093373 | 21 |
| SW15 2 | 2400000 | 1 | 1465000 | 1 | 1129571 | 7 | 504833 | 15 | 806021 | 24 |
| SW15 3 | 0 | 0 | 0 | 0 | 867500 | 2 | 551550 | 9 | 608995 | 11 |
| SW15 4 | 0 | 0 | 0 | 0 | 525000 | 1 | 250000 | 1 | 387500 | 2 |
| SW15 5 | 2436000 | 1 | 655000 | 2 | 582479 | 6 | 428883 | 9 | 616712 | 18 |
| SW15 6 | 1301000 | 2 | 1152500 | 2 | 0 | 0 | 430791 | 17 | 582402 | 21 |
| Total | 1859500 | 4 | 1275714 | 7 | 1035722 | 26 | 496897 | 60 | 753717 | 97 |
| Last quarter | -36.5% | -20.0% | 0.3% | -36.4% | -3.5% | 36.8% | 0.6% | -34.8% | 1.4% | -23.6% |
| Last year | -1.1% | 33.3% | -25.5% | -41.7% | 0.6% | -39.5% | 5.0% | -45.0% | 3.1% | -41.9% |
| Last three years | 1.0% | -33.3% | 5.4% | -12.5% | 24.1% | 4.0% | -18.8% | -53.5% | 5.0% | -42.3% |
| Last five years | -36.6% | -81.8% | -7.6% | -68.2% | 6.2% | -48.0% | -0.5% | -74.1% | -5.3% | -70.2% |
| Last ten years | 5.7% | -42.9% | 109.2% | -12.5% | 91.1% | -23.5% | 45.3% | -30.2% | 56.5% | -28.1% |
Copyright notice: All figures in this article are based on data released by the Land Registry. The numbers are derived from analysis performed by PutneySW15.com. Any use of these numbers should jointly attribute the Land Registry and PutneySW15.com.
August 8, 2019