No Spring Bounce for Hammersmith Property Market
With sales of both terraced houses and flats grinding to a halt
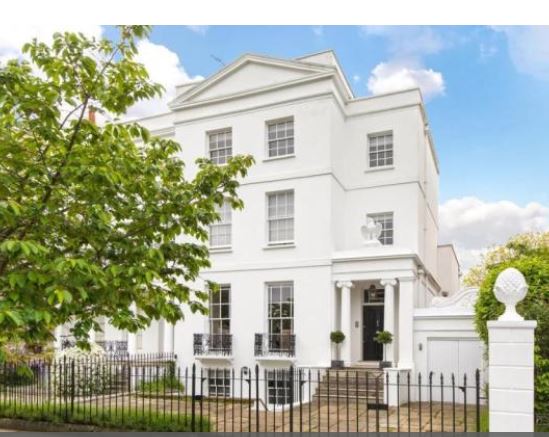
29 St Peter's Square, Hammersmith
The property market in Hammersmith shows no sign of bouncing back in 2018, with the volume of sales of both terraced houses and flats down in the second quarter by over a half on the same period last year.
Property prices are also falling, with Land Registry figures for April to June showing the average price of terraced houses dropping 17.4% from the previous quarter to £1,249,974. The average price of local flats slid by an even larger 22.3% to £692,690 although low volumes are making price comparisons increasingly difficult. The overall price average has been stable as turnover in flats has fallen more quickly than that for houses and because of one-off sales.
Unlike other local areas, this drop is not solely due to the public turning away from new build flats, as a number of sales were recorded at new developments Sovereign Court in Glenthorne Road.
However, while some apartments at this development have come with multi-million pound price tags, the sales during this period were of more affordable properties, with prices starting at under £300,000.

As with the previous quarter, riverside development Queen's Wharf once again bucked current trends, with two flats changing hands for £1,500,000 and £2,048,500. This development, close to Hammersmith Bridge, has now almost sold with just two flats left, a studio priced £599,000 or a three bedroom, fifth floor penthouse pictured above, priced £2,700,000.
At the very top of the market meanwhile, a rarely available five bedroomed house in Hammersmith's most exclusive garden square St Peter's Square, pictured at the top of the page, was snapped up for £4,750,000.
With so few transactions recorded between April and June, this one high price was enough to raise the overall average property price by 4.6% to £1,024,726 - though this was still down by a tiny 0.3% on the same period one year ago.
This subdued property market, amidst continuing uncertainty over Brexit is gloomy news for local estate agents. In its latest quarterly residential market report, Strutt and Parker says:
" We expect this stagnation in prices to persist for the remainder of 2018 with the possibility of further negative growth as both globally and domestically the economy and political environments remain volatile.
"From 2019 onwards it is extremely difficult to forecast this market with any certainty but we would expect some bounce back once more stability has returned."

The latest House Price Index data published by the Land Registry shows that London prices are the only ones that have fallen over the last year (to May) with the average now £478,853.
Figures for July from the Nationwide House Price Index show that the average price of a home in the UK rose by 2.5% to £217,010.
The was before the Bank of England’s Monetary Policy Committee (MPC) will increased rates at their next meeting at the beginning of the month from 0.5% to 0.75%.
There is not a high degree of concern that the rise in interest rates will have much impact on the property market. Commenting on the figures, Robert Gardner, Nationwide's Chief Economist, said, “Providing the economy does not weaken further, the impact of a further small rise in interest rates on UK households is likely to be modest.
“This is partly because only a relatively small proportion of borrowers will be directly impacted by the change. Most lending on personal loans and credit cards is fixed or tends to be unaffected by movements in the Bank Rate. Similarly, in recent years, the vast majority of new mortgages have been extended on fixed interest rates.”
| Hammersmith Property Prices (April - June 2018) | ||||||||
|---|---|---|---|---|---|---|---|---|
Area |
Semi- |
Sales |
Terrace |
Sales |
Flat/ |
Sales |
Overall Ave |
Overall Sales |
| W6 0 | 1892500 | 2 | 1451786 | 7 | 493271 | 18 | 845421 | 27 |
| W6 7 | 0 | 0 | 1457333 | 3 | 1012333 | 3 | 1234833 | 6 |
| W6 8 | 1200000 | 1 | 980000 | 5 | 557875 | 4 | 833150 | 10 |
| W6 9 | 3076025 | 2 | 1078750 | 4 | 1221000 | 6 | 1482754 | 12 |
| Total | 2227410 | 5 | 1249974 | 19 | 692690 | 31 | 1024726 | 55 |
| Last quarter | 43.7% | 150.0% | -17.4% | 18.8% | -22.3% | -71.8% | 4.6% | -57.0% |
| Last year | 20.0% | 66.7% | -4.1% | -51.3% | -23.8% | -73.9% | 0.3% | -65.8% |
| Last three years | 65.0% | 400.0% | -0.2% | -44.1% | 12.8% | -63.1% | 26.7% | -54.5% |
| Last five years | 9.6% | 0.0% | 13.1% | -45.7% | 70.1% | -60.3% | 49.9% | -53.8% |
| Last ten years | 111.9% | 25.0% | 82.5% | -9.5% | 92.1% | -40.4% | 111.3% | -28.6% |
Source: Land Registry
August 17, 2018
Related links
|