'The First Time Buyer Has Rarely Had It So Good'
Subdued property market in W6 is good news for those with smaller budgets
The Hammersmith property market remains quiet in 2017, with the volume of sales low and the prices of both terraced houses and flats sliding downwards.
However, a shift in the balance of properties changing hands, with more houses being sold during the first quarter of the year, meant the overall average price remained almost static at £956,537 - a slip of just 0.2% from the previous three months.
While Land Registry figures show that sales of terraced houses were brisk, the average price fell by 13.6%, down to £1,369,567. The average price of flats meanwhile dropped even further, down by 23.1% to £640,727.
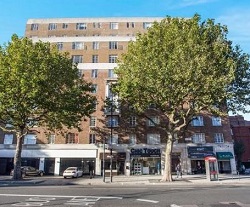
Again, this fall was partly due to a change in the type of flats attracting buyers, with Hammersmith's upmarket new developments no longer dominating the market. While three sales were recorded at riverside development Fulham Reach, with price tags of £2,000,000 to £3,850,000, the vast majority of sales were of older properties with much lower price tags, including some small studio flats in blocks such as Kings Court in Hamlet Gardens priced around £265,000.
And this trend is continuing this summer, with around 50 studio and one bedroom flats available across Hammersmith for under £400,000.
This, says Teresa Brewer of agents Finlay Brewer in Brook Green, is good news for those climbing onto the bottom rungs of the property ladder. " Pricing correctly for a sale is the name of the game," she says." With record low interest rates, mortgages have never been so affordable or so achievable.
"Recent studies have shown that the number of people being refused a mortgage has dropped by almost half over the past year. That ubiquitous 'first time buyer' has rarely had it so good. Likewise, the self-employed are finding their access to mortgage finance is better than it’s been since the onset of the credit crunch in 2008."
To those buying for the first time, Portico’s Regional Sales Director, Mark Lawrinson, says: "When buying a property to live in, try to think of it as a home first and an investment second. If you’re planning to live there for the long term then little bumps in the market shouldn’t affect you.
"London is a resilient city - as we’ve seen time and time again - so if there is a price correction over the next few years, it will be insignificant if you plan on being there for another ten. Ultimately, no one can predict the market, but a stable government and a visible plan for how Brexit will pan out will instil some much needed political confidence, which should have a positive effect on the market."
Looking at the wider picture, Simon Rubinsohn, RICS Chief Economist sees the lettings market as being stronger than the sales side. He said, "It is noticeable that the amount of new rental instructions coming through to agents is continuing to edge lower, which is not altogether surprising given the changing landscape for buy-to-let investors. One consequence of this is that rents are expected to continue rising not just in the near term but also further out and at a faster pace than house prices."
During March 2017 London was the worst performing region of the country according to the Land Registry with prices falling by 1.5% from the previous month to £471,742. Over the course of the last twelve months prices have risen by 1.5%.
For England as a whole prices are up by 4.4% in the year to March rising to an average of £232,530.
The number of completed house sales in London in January, the latest month for which figures are available, fell by 26.3% to 5,968 compared with 8,093 in January 2016.
| Hammersmith Property Prices (January - March 2017) | ||||||||
|---|---|---|---|---|---|---|---|---|
Area |
Semi- |
Sales |
Terrace |
Sales |
Flat/ |
Sales |
Overall Ave |
Overall Sales |
| W6 0 | 1836552 | 2 | 1427571 | 7 | 605661 | 14 | 962841 | 23 |
| W6 7 | 0 | 0 | 1850000 | 2 | 549120 | 14 | 711730 | 16 |
| W6 8 | 0 | 0 | 1089000 | 9 | 834000 | 5 | 997929 | 14 |
| W6 9 | 968750 | 1 | 1562601 | 6 | 842487 | 4 | 1246755 | 11 |
| Total | 1547285 | 3 | 1369567 | 24 | 640727 | 37 | 956537 | 64 |
| Last quarter | - | - | -13.6% | 50.0% | -23.1% | -53.8% | -0.2% | -34.0% |
| Last year | - | - | -0.9% | -31.4% | 11.0% | -59.3% | 14.5% | -50.8% |
| Last three years | - | - | 4.4% | -11.1% | 43.4% | -51.9% | 31.5% | -40.2% |
| Last five years | - | - | 30.0% | 0.0% | 83.7% | -39.3% | 71.0% | -27.3% |
| Last ten years | - | - | 93.8% | -51.0% | 111.2% | -61.1% | 108.2% | -57.0% |
Source: Land Registry
May 26, 2017
Related links
|

