Fulham Property Market Shows First Signs of Recovery
Buoyant house sales and prices help SW6 to shrug off Brexit blues
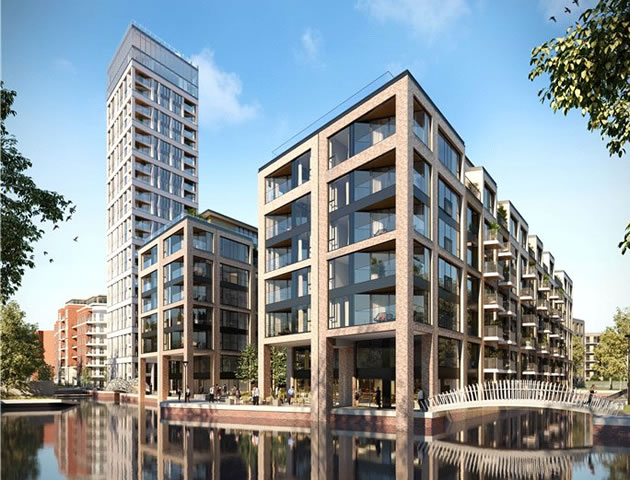
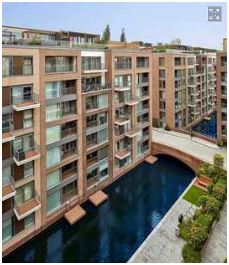
Top priced sale recently was a flat in the Lockside House development
After months in the doldrums, Fulham's property market appears to be shrugging off the Brexit blues and showing the first signs of recovery.
Between June and September, the overall average price rose by 16.5% from the previous quarter to £1,179.977.
This also represented a modest rise of 2.7% over the same three months in 2017.
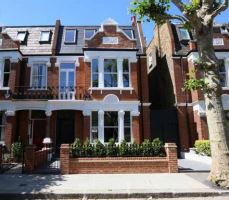
This positive picture is mainly due to buoyant sales of traditional houses in popular areas including the Peterborough estate and the 'Alphabet streets' on the western side of Fulham next to the river.
The number of sales of both semi-detached and terraced houses were up on the previous quarter, as were prices. The average prices of terraced houses rose by a small 2.6% to £1,615,187 and among six sales of semi-detached houses, the average climbed by 12.3% to £2,179,992.
The most expensive property sold during the period was an apartment in the Lockside House development in Chelsea Creek that went for £4,300,000. This was only the 25th highest price ever paid for flat in the SW6 post code area.
The highest priced house was of the above six bedroomed semi-detached house in Ellerby Street, close to Bishops Park which changed hands for £4,050,000.
Guy Robinson, head of residential at Strutt and Parker, says the estate agency has recorded 'a steady performance' this autumn, adding," Transaction levels have been encouraging in comparison to last year and the number of registered buyers is gradually increasing, as are the viewing numbers, outstripping 2017.
"Homebuyers are no longer using the uncertain political climate as a reason to sit on their hands and those who need to make a move are serious about selling which is keeping the market in motion."
The average price of flats in Fulham remained steady, with an overall average of £723,083, a tiny 0.2% down from the previous quarter, though still 14.1% down on the previous year.
The number of sales also remained low, partly due to the continuing freeze in the market for upmarket luxury apartments. The Land Registry records just two sales of new build properties in the third quarter of 2018, though one, at Lockside House in Chelsea Creek, shown below did have a price tag of £4,300,00.
As with houses, the vast majority of flat buyers were instead choosing from Fulham's range of traditional properties, including ever-popular blocks such as Drive Mansions in Fulham Road, Rivermead Court in Ranelagh Gardens and Brompton Park Crescent in Seagrave Road.

The latest figures from the Nationwide’s House Price Index show that prices nationally have continued to rise slowly with the average sale price now £214,534 up by 1.6% over the year.
Commenting on the figures, Robert Gardner, Nationwide's Chief Economist, said, “Looking further ahead, much will depend on how broader economic conditions evolve. If the uncertainty lifts in the months ahead, there is scope for activity to pick-up throughout next year. The squeeze on household incomes is already moderating and policymakers have signalled that interest rates are only expected to raise at a modest pace and to a limited extent in the years ahead.”
The October 2018 RICS UK Residential Market Survey results show the recent softening in new buyer demand beginning to feed into a slightly negative trend for national house prices in the view of the surveyors’ industry body.
The report says, “A sustained softening in demand over recent months has likely driven the weaker price trends in parts of the country. The net balance for new buyer enquiries ticked down to -14% in October (compared with -12% last month), marking three successive reports in which headline demand has deteriorated. Affordability pressures, political uncertainty and a lack of fresh stock coming onto the market all continue to hinder activity to varying degrees.”
The report adds that new instructions to surveyors continue to fall meaning stock levels remain close to all-time lows and rendering any chance of a meaningful turnaround in the near future unlikely. A net balance of 30% of respondents reported the level of appraisals being undertaken to be down on an annual comparison.
Looking ahead, respondents in London and the South East were the most negative with price falls expected over the next twelve months.
Updates on the local property market are regularly published in the Fulham newsletter.
| Fulham Property Prices (July - September 2018) | ||||||||
|---|---|---|---|---|---|---|---|---|
| Area | Semi-det | Sales | Terraced | Sales | Flat/ mais |
Sales | Overall ave | Total sales |
| SW6 1 | 0 | 0 | 1166667 | 3 | 737222 | 9 | 844583 | 12 |
| SW6 2 | 0 | 0 | 1940000 | 3 | 796776 | 20 | 945892 | 23 |
| SW6 3 | 0 | 0 | 1824308 | 13 | 839700 | 10 | 1396217 | 23 |
| SW6 4 | 0 | 0 | 1829386 | 12 | 646625 | 12 | 1238005 | 24 |
| SW6 5 | 1606650 | 3 | 1842001 | 8 | 686500 | 12 | 1208433 | 23 |
| SW6 6 | 2753333 | 3 | 1665095 | 13 | 711000 | 5 | 1593392 | 21 |
| SW6 7 | 0 | 0 | 1087964 | 14 | 554286 | 8 | 893899 | 22 |
| Total | 2179992 | 6 | 1615187 | 66 | 723083 | 76 | 1179977 | 148 |
| Change over quarter | 12.3% | 50.0% | 2.6% | 34.7% | -0.2% | -29.6% | 16.5% | -8.1% |
| Change over year | -15.3% | 20.0% | -6.0% | 3.1% | -14.1% | -47.9% | 2.7% | -31.5% |
| Change over three years | -37.1% | 100.0% | -6.0% | -26.7% | -11.1% | -65.0% | 7.1% | -52.3% |
| Change over five years | -16.4% | -14.3% | 3.0% | -51.5% | 15.3% | -72.0% | 21.8% | -64.3% |
| Change over ten years | 15.1% | 20.0% | 59.7% | 22.2% | 31.3% | -31.5% | 60.9% | -13.5% |
November 16, 2018