Downward Slide Continues for Fulham Property Prices
With flat buyers turning from new developments to lower priced traditional homes
Fulham property prices are continuing their downward slide, with the average value slumping to just over the million mark at £1,031,814 in the first three months of 2018 - a drop of 13.2% over the previous quarter.
Fulham, which was recently described as "ground zero" of London's slowing market by the Financial Times, also had a low number of transactions, with the Land Registry recording just 93 between January and March.
Though this figure may be augmented by some late entries, it is a far cry from the heady days of 2014, when prices were soaring to new heights and 300 properties changed hands over the same three months.
As in previous quarters, the main reason for the price drop was the change in properties being sold, particularly in flats.
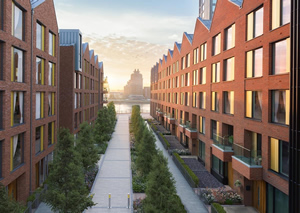
While they were some resales of new build properties, including one in the Riverwalk Apartments at Fulham Riverside, priced £1,295,000, the main focus once again shifted from new developments to traditional conversions or purpose built ex-local authority homes.
The result was both fewer sales and a 27.7% fall in the average price to £671,516.
The good news for young people and first time buyers in particular is that even this average is now high, with around a third of the total number of sales attracting price tags under half a million pounds and ten below £400,000, including a flat in Wheatsheaf Lane, close to the river, priced £399,950.
The top of the market, meanwhile, while also slow, was relatively robust, with a dozen houses sold for over £2,000,000. The most expensive during the period was a six bedroom home in Favart Road overlooking Eel Brook Common which achieved £3,755,000.

However, in the current market, Lucy Pendleton, co-founder of independent estate agents James Pendleton says they are advising vendors to be realistic and price their property keenly. to fuel interest.
She says: " The difference between asking
and sold price proves just how many houses have been priced badly recently and that always happens when we
see a shift from a sellers’ to a buyers’ market in London. Many sellers could have improved the amount paid for
their homes if they had encouraged more viewings on day one, rather than going for gold with an overambitious
ticket price."
KFH's spring report meanwhile acknowledges that activity levels have been and the market smaller than it was. However it adds: " While rising prices excite owners in the short term, they also cause anxiety for buyers. For anyone taking a long-term view on property ownership, owning a piece of real estate in one of the world’s greatest cities, whether as a home or an investment, retains its fundamental appeal through short-term cycles."

According to the Nationwide House Price Index, property values in London as a whole fell by 1% in March compared with the same month last year. For the UK overall prices are up by 2.1% and the gap between the capital and the rest of the country has been slowly reduced over the last few months.
Commenting on the figures, Robert Gardner, Nationwide's Chief Economist, said: “Looking ahead, much will depend on how broader economic conditions evolve, especially in the labour market,
but also with respect to interest rates. Subdued economic activity and the ongoing squeeze on household budgets is likely to continue to exert a modest drag on housing market activity and house price growth this year."
Home ownership rates have declined across all English regions over the past decade. While the decline has been fairly uniform across regions, the biggest reduction has been in London, where the home ownership rate has fallen from 57% to 47%. The counterpart to this has been robust growth in the private rental sector; for example, 30% of households in London now rent.
The RICs say that their surveyor members report on balance an expectation of no price rises over the next 12 months representing the joint lowest reading since February 2013. Regionally, there continues to be significant variation in the house price indicator. London, exhibits the weakest feedback, with a net balance of -47% of respondents citing further price declines.
Updates on the local property market are regularly published in the Fulham newsletter.
| Fulham Property Prices (January - March 2018) | ||||||||
|---|---|---|---|---|---|---|---|---|
| Area | Semi-det | Sales | Terraced | Sales | Flat/ mais |
Sales | Overall ave | Total sales |
| SW6 1 | 0 | 0 | 1042500 | 2 | 600500 | 5 | 726786 | 7 |
| SW6 2 | 0 | 0 | 1152500 | 3 | 661387 | 17 | 735054 | 20 |
| SW6 3 | 0 | 0 | 2171500 | 4 | 855429 | 7 | 1334000 | 11 |
| SW6 4 | 2200000 | 1 | 2090100 | 5 | 890600 | 5 | 1554864 | 11 |
| SW6 5 | 0 | 0 | 1733125 | 4 | 646067 | 3 | 1267243 | 7 |
| SW6 6 | 2300000 | 1 | 1588333 | 6 | 571675 | 10 | 1032162 | 17 |
| SW6 7 | 0 | 0 | 1204080 | 10 | 593438 | 10 | 898759 | 20 |
| Total | 2250000 | 2 | 1564185 | 34 | 671516 | 57 | 1031814 | 93 |
| Change over quarter | 1.0% | -33.3% | -11.0% | -46.0% | -27.7% | -62.0% | -13.2% | -56.9% |
| Change over year | -3.8% | -60.0% | 3.1% | -27.7% | -24.7% | -64.6% | -3.0% | -56.3% |
| Change over three years | 84.4% | 0.0% | -3.3% | -32.0% | -4.5% | -49.1% | 4.4% | -43.3% |
| Change over five years | -17.7% | -33.3% | 7.8% | -66.3% | 17.0% | -67.4% | 12.8% | -66.7% |
| Change over ten years | - | - | 56.8% | -51.4% | 16.9% | -66.7% | 48.0% | -61.4% |
May 18, 2018
Related links
|