Average Fulham Property Price Bounces Back Above One Million
Flat values soar but sales at top of market remain slow
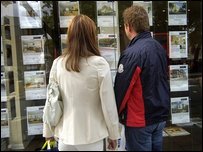
The post election bounce predicted by local estate agents appears to have happened in the second quarter of 2015, with the average Fulham property price jumping back above one million pounds and a particularly strong rise in the value of flats.
From a slump, possibly caused by pre-election jitters, of 11.1% to £988,209 in the first three months, the overall average price jumped by 14.4% to reach £1,130,841.
Over the year, the average has risen 4.8% but this total is still below the all time high of £1,180,367 achieved last autumn.
This is partly due to the mix of properties changing hands, with 189 flat sales in the second quarter - a massive rise of 68.8% over the previous three months, when the total was 112.
The price of flats also showed a spectacular rise of 21.8% from £703,451 during January to March to £857,028 between April and June. This hike is mainly due to sales at upmarket new developments such as Chelsea Creek, Lillie Square and The Landau in Farm Lane, where one bedroom apartments are currently priced from £895,000.
This new average means that flat prices have soared by 21.4% over the year and 83.8% over five years.
While the number of terraced houses changing hands rose by 50% from 54% in the winter months to 77 in spring, the average price rose by a smaller 6.3%, from £1,616,795 to creep closer to the two million mark at £1,719,318.
At the very top of the market, the average price of a semi-detached house rose to £2,740,310 but this average is based on the sale of just four properties.
With over 100 houses in SW6 currently listed for sale on property portals with prices above £2 million, estate agents must be hoping this end of the market speeds up in the second half of the year.

June data from the Land Registry showed that the average house price in London increased by 9.2% over the same period in 2014. This brings the average to £481,820. For England and Wales as a whole the average price rose by 5.4% to an new all-time high of £181,619. The previous record was in November 2007 before the financial crisis.
The number of completed house sales in England & Wales during April 2015 decreased by 19% to 57,180 compared with 70,244 in April 2014 and the number of properties sold in England and Wales for over £1 million decreased by 22%to 874 from 1,114 a year earlier. There were only 41 repossessions in London in April - half of the level seen a year ago.
The latest RICS UK Residential Market Survey shows that house prices continue to be squeezed higher by growing demand and contracting supply in London. While 40% more chartered surveyors saw prices rise in London in July, supply to the market continued to decline with 16% more respondents reporting a fall in new instructions. Additionally, the shortage of housing inventory worsened further in the capital during July, with the average number of properties for sale per surveyor in London slipping to the lowest figure since February 2014.
Near term expectations for prices also continue to reflect the imbalance between demand and supply with 48% of members expecting prices to continue to rise in London over the next three months. This is the highest level since March 2014. However, rising prices have not dampened interest as new buyer enquiries rose for the fourth month in succession, with 36% of respondents reporting a rise in demand in the capital. Despite this steady and sustained improvement in demand, newly agreed sales continued to decline in London. Going forward, there is more optimism regarding the prospects for activity with 37% more respondents expecting sales to gain momentum over the next three months.
Simon Rubinsohn, RICS Chief Economist, said, “A renewed acceleration in house price inflation allied to a fairly flat trend in sales activity highlights the very real challenges being presented by the housing market. More worrying still is the suspicion that the imbalance between supply and demand will lead to even strong price gains over the next twelve months. This is also visible in the firmer pattern in the buyer enquiries series which has now risen for four months in succession reflecting in part, a further modest easing in credit conditions. This trend could be brought to a halt when base rates do eventually begin to rise but the dovish tone to the latest Bank of England Inflation Report suggests the first move will come a little later than previously thought likely and that subsequent increases will be very gradual indeed.’’
A detailed listing of properties sold recently in the area will be appearing in a forthcoming edition of the Fulham newsletter.
| Fulham Property Prices (April - June2015) | ||||||||
|---|---|---|---|---|---|---|---|---|
| Area | Semi-Det | Sales | Terraced | Sales | Flats/ Mais |
Sales | Overall Ave | Total Sales |
| SW6 1 | 0 | 0 | 2587500 | 2 | 908633 | 36 | 996995 | 38 |
| SW6 2 | 0 | 0 | 1487222 | 9 | 1036574 | 73 | 1086035 | 82 |
| SW6 3 | 0 | 0 | 2197025 | 22 | 729654 | 13 | 1652001 | 35 |
| SW6 4 | 0 | 0 | 1538100 | 10 | 711299 | 15 | 1042020 | 25 |
| SW6 5 | 2450000 | 1 | 1718846 | 13 | 685627 | 11 | 1293476 | 25 |
| SW6 6 | 2837080 | 3 | 1530125 | 8 | 651668 | 18 | 1120078 | 29 |
| SW6 7 | 0 |
0 |
1194300 | 13 | 616121 | 23 | 824908 | 36 |
| Total | 2740310 | 4 | 1719318 | 77 | 857028 | 189 | 1130841 | 270 |
| Change over quarter | 124.6% | 100.0% | 6.3% | 54.0% | 21.8% | 68.8% | 14.4% | 64.6% |
| Change over year | 16.3% | -33.3% | 5.3% | -6.1% | 21.4% | 0.5% | 4.8% | -2.9% |
| Change over three years | - | - | 30.5% | -27.4% | 55.8% | -1.6% | 37.4% | -9.4% |
| Change over five years | - | - | 58.1% | -28.0% |
83.8% |
6.8% |
61.5% |
-4.9% |
| Change over ten years | - | 127.2% | - | |||||
August 28, 2015