Fulham's Coronavirus Death Toll Revealed
Figures showing fatalities at a local level published for the first time

Detailed data about the coronavirus outbreak has been published which shows that up until the middle of last month 32 people in the Fulham area have died from the disease.
The Office of National Statistics (ONS) have published the number of fatalities at a very local level for the first time. The data is based on the analysis of registration of deaths including the residence of the deceased between 1 March and 17 April 2020 and where coronavirus was the underlying cause or was mentioned on the death certificate as a contributory factor.
Roughly speaking Fulham is divided into eleven Middle Layer Super Output areas by the ONS. Based on a very limit set of data, the area designated as Fulham Broadway in the analysis seems to have been relatively badly hit with 9 deaths. It is thought possible that a higher number of care home in this area goes some way to explaining the apparently elevated death rate. Munster and Fulham Aintree on the other hand recorded no deaths at all.
| Area | Covid-19 Deaths | Total Deaths | Covid-19 (%) |
|---|---|---|---|
Lillie Road & Greyhound Road |
3 |
6 |
50 |
Sands End & Chelsea Harbour |
4 |
8 |
50 |
South Park |
2 |
6 |
33 |
Hurlingham Park |
1 |
7 |
14 |
Parsons Green West |
1 |
3 |
33 |
Parsons Green East & Eel Brook Common |
2 |
10 |
20 |
| Fulham Broadway (MSOA Hammersmith and Fulham 017) |
9 |
16 |
56 |
| Fulham Reach (MSOA Hammersmith and Fulham 018) |
5 |
13 |
38 |
| North End (MSOA Hammersmith and Fulham 015) |
5 |
10 |
50 |
| Munster (MSOA Hammersmith and Fulham 022) |
0 |
3 |
0 |
| Fulham Aintree (MSOA Hammersmith and Fulham 019) |
0 |
0 |
0 |
Source: ONS
There were 220 deaths in the borough of Hammersmith & Fulham of which 100 were attributed to the virus. This gives a death rate of 96.4 making it the eleventh worst hit local authority areas in the country. All of the top ten were London boroughs with Newham having the highest death rate of 144.3.
| Death Rates by London Borough to 17 April | ||||
|---|---|---|---|---|
| Borough | All Deaths | Rate | Covid-19 Deaths | Rate |
| Newham | 421 | 298.7 | 208 | 144.3 |
| Brent | 550 | 256.9 | 304 | 141.5 |
| Hackney | 304 | 263.5 | 146 | 127.4 |
| Tower Hamlets | 260 | 239.3 | 132 | 122.9 |
| Haringey | 314 | 222.1 | 168 | 119.3 |
| Harrow | 487 | 229.2 | 241 | 114.7 |
| Southwark | 320 | 219.0 | 156 | 108.1 |
| Lewisham | 393 | 244.1 | 172 | 106.4 |
| Lambeth | 361 | 233.7 | 165 | 104.3 |
| Ealing | 538 | 230.4 | 239 | 103.2 |
| Hammersmith and Fulham | 220 | 209.7 | 100 | 96.4 |
| Waltham Forest | 343 | 210.8 | 151 | 92.5 |
| Barking and Dagenham | 271 | 229.5 | 103 | 89.2 |
| Enfield | 542 | 225.9 | 220 | 91.3 |
| Barnet | 687 | 216.9 | 287 | 91.6 |
| Islington | 227 | 208.0 | 88 | 80.7 |
| Greenwich | 376 | 230.9 | 140 | 84.6 |
| Croydon | 573 | 201.0 | 252 | 88.0 |
| Merton | 320 | 228.9 | 117 | 83.0 |
| Redbridge | 441 | 209.1 | 174 | 82.9 |
| Wandsworth | 345 | 209.7 | 132 | 80.2 |
| Westminster | 274 | 164.5 | 120 | 72.3 |
| Hillingdon | 447 | 199.8 | 164 | 73.0 |
| Kensington and Chelsea | 171 | 134.7 | 84 | 66.8 |
| Hounslow | 317 | 190.0 | 120 | 69.2 |
| Havering | 516 | 199.5 | 166 | 64.6 |
| Sutton | 322 | 188.2 | 96 | 56.7 |
| Camden | 214 | 127.9 | 91 | 55.2 |
| Bexley | 381 | 165.4 | 125 | 54.8 |
| Richmond upon Thames | 229 | 136.7 | 77 | 47.0 |
| Kingston upon Thames | 241 | 178.4 | 57 | 42.9 |
| City of London | 9 | 106.2 | 3 | 35.2 |
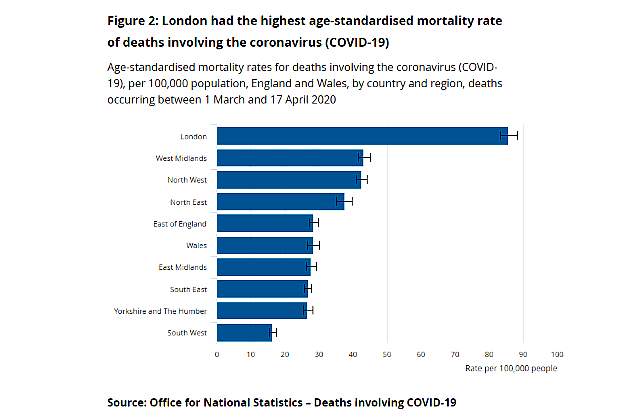
There were 90,232 deaths occurring in England and Wales that were registered by 18 April; 20,283 of these deaths involved the coronavirus. When adjusted for size and age structure of the population, there were 36.2 deaths involving Covid-19 per 100,000 people in England and Wales.
London had the highest age-standardised mortality rate with 85.7 deaths per 100,000 persons; this was statistically significantly higher than any other region and almost double the next highest rate.
The age-standardised mortality rate of deaths involving Covid-19 in the most deprived areas of England was 55.1 deaths per 100,000 population compared with 25.3 deaths per 100,000 population in the least deprived areas.

Nick Stripe, Head of Health Analysis, Office for National Statistics said, “People living in more deprived areas have experienced Covid-19 mortality rates more than double those living in less deprived areas. General mortality rates are normally higher in more deprived areas, but so far Covid-19 appears to be taking them higher still.”
Figures on deaths published by the ONS differ from those produced by the Department of Health and Social Care (DHSC) and the UK's public health agencies for two main reasons: the time between death and reporting of the death and the ONS's wider inclusion criteria.
Like Reading Articles Like This? Help Us Produce More This site remains committed to providing local community news and public interest journalism. Articles such as the one above are integral to what we do. We aim to feature as much as possible on local societies, charities based in the area, fundraising efforts by residents, community-based initiatives and even helping people find missing pets. We’ve always done that and won’t be changing, in fact we’d like to do more. However, the readership that these stories generates is often below that needed to cover the cost of producing them. Our financial resources are limited and the local media environment is intensely competitive so there is a constraint on what we can do. We are therefore asking our readers to consider offering financial support to these efforts. Any money given will help support community and public interest news and the expansion of our coverage in this area. A suggested monthly payment is £8 but we would be grateful for any amount for instance if you think this site offers the equivalent value of a subscription to a daily printed newspaper you may wish to consider £20 per month. If neither of these amounts is suitable for you then contact info@neighbournet.com and we can set up an alternative. All payments are made through a secure web site. One-off donations are also appreciated. Choose The Amount You Wish To Contribute. If you do support us in this way we’d be interested to hear what kind of articles you would like to see more of on the site – send your suggestions to the editor. For businesses we offer the chance to be a corporate sponsor of community content on the site. For £30 plus VAT per month you will be the designated sponsor of at least one article a month with your logo appearing if supplied. If there is a specific community group or initiative you’d like to support we can make sure your sponsorship is featured on related content for a one off payment of £50 plus VAT. All payments are made through a secure web site. |
May 3, 2020