Falling Ealing Flat Prices Present Challenge For Developers
Secondary market saw double digit decline during 2018
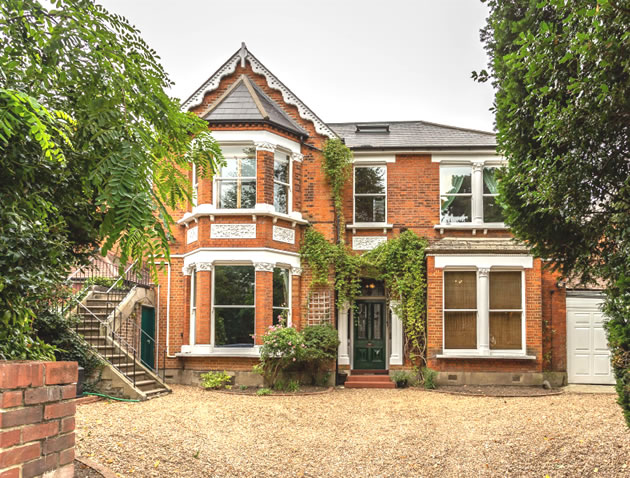
House in Mount Park Road with recording studio went for £2,750,000
Growing evidence of softness in flat prices in the Ealing area is adding to the challenges for developers in the area.
The latest figure from the Land Registry shows a double digit decline in the average price of a flat in the W5 post code area over 2018 to £565,740.
One local agent said, "The headline numbers can be misleading because we have had a distortion in the Ealing market due to very high priced sales in Dickens Yard but what is clear is that on a like-for-like basis over the course of last year, the price of apartments is down by over 10%.
"Given the amount of bad news the market has had over the year with Brexit and stamp duty things could have been worse but the postponement of Crossrail is another blow and there may be some overhang due to speculative purchases needing to be cleared before a sustained recovery is possible."
Demand hasn't totally evaporated and eleven sales were recorded in Quartz House, Dickens Yard with prices reaching as high as £1.8 million. These were recorded by the Land Registry as secondary market sales which could suggest that the developer is off-loading inventory it had previously held back from the market.
No sales yet have been recorded at the Filmworks development in central Ealing. It has been suggested to us that this could be because the units are available to be reserved only at the moment and not being transacted as a full sale.
A spokesperson for the developer St. George said, "We have brought several parcels of land together to successfully bring Filmworks to the market and so, pending the search on Land Registry, it may not be readily possible to identify sales to date. We would also point to the fact that it can often take some time for sales to be processed on Land Registry which is normal and expected.
"We do not confirm the number of sales for developments across our portfolio, however since the launch of the Filmworks development in 2018 we have enjoyed significant interest which is a reflection of the high quality design of the homes and public realm.
"Following the success of Filmworks we are looking forward to the final launch with the unveiling of the next phase, Chapman House in April 2019."
The trend of larger family houses in the area seeing more resilient demand has continued with £2,750,000 being paid for a detached house on Mount Park Road which comes with its own recording studio. The sale took place at the beginning of 2019 and originally the property was marketed at £2,950,000. Other recent high price sales include a house on Gordon Road that went for £2,600,000 and another on Castlebar Road that changed hands for £2,450,000.
Overall prices in the W5 postcode area were down by 3% in 2018 but the overall number is masking greater price weakness as the proportion of houses compared to flats increased over the year. The price of the average terraced house fell by 6.9%
In West Ealing the price decline was more marked with a 13.3% decline. Unlike in W5, the W13 postcode area didn't see a relative increase in the proportion of higher priced family homes being sold.

UK house prices grew by 2.5% in the year to December 2018. This is the lowest annual growth for the UK since July 2013. London property prices fell marginally over the year with only the North East also seeing a decline.
Tom Bill, Partner and Head of London Residential Research at Knight Frank said, "The influence of political uncertainty on the prime London property market has grown markedly in the last six months. In the first half of 2018 there were signs the market was beginning to rally as asking prices adjusted more fully to reflect higher transaction costs.
"However, with Brexit uncertainty persisting ahead of the UK’s planned departure from the EU, sales volumes in prime outer London were down by 10% year-on-year in January and the annual price decrease widened to 4.6%.
"Identifying individual factors affecting the performance of the prime London property market can be a complex task but the impact of political uncertainty was decisive during 2018. Indeed, economic sentiment indicators displayed a similar trend. The Lloyds business barometer began the year with a reading of 35% in January but had fallen to 17% by December.
"However, there are signs that pent-up demand is building. The number of new prospective buyers registering rose by 5% across prime London markets in 2018. Indeed, the ratio of new demand to new supply rose to 4.9 in the final quarter of 2018, the highest level in four years.
While it is unknown when the current level of political uncertainty will recede, the conditions for a recovery in the London property market appear to be taking shape.
Robert Gardner, Nationwide's Chief Economist, said ““Indicators of housing market activity, such as the number of property transactions and the number of mortgages approved for house purchase, have remained broadly stable in recent months, but forward-looking indicators had suggested some softening was likely.
“In particular, measures of consumer confidence weakened in December and surveyors reported a further fall in new buyer enquiries towards the end of 2018. While the number of properties coming onto the market also slowed, this doesn’t appear to have been enough to prevent a modest shift in the balance of demand and supply in favour of buyers in recent months.”
The Bank of England’s Agents’ summary of business conditions for 2018 Q4 reported that along with low supply of houses, demand was also falling. Housing activity in southern England was muted due to uncertainty, with transactions postponed until after the EU withdrawal. The demand for new build houses remained stronger outside London, in part due to house builders offering more incentive to finalise sales.
The Royal Institution of Chartered Surveyors’ (RICS) UK Residential Market Survey for December 2018 reported that new buyer enquiries fell for the fifth month in a row. This fall in demand was accompanied by a lack of fresh stock coming into the market as the survey’s indicator on new instructions remained in negative territory for the sixth report in a row.
The UK Property Transactions Statistics for December 2018 showed that on a seasonally adjusted basis, the number of transactions on residential properties with a value of £40,000 or greater was 102,330. This is 3.6% higher than a year ago. Between November 2018 and December 2018, transactions fell by 0.1%.
The Bank of England’s Money and Credit latest release showed that mortgage approvals for house purchases (an indicator of future lending) were around 63,800 in December, unchanged from November, but slightly below their 2018 average of around 65,200.
| Ealing W5 Post Code Area Property Prices - (October - December 2018) | ||||||||||
|---|---|---|---|---|---|---|---|---|---|---|
Area |
Detached |
Sales |
Semi-detached |
Sales |
Terraced |
Sales |
Flat/ |
Sales |
Overall Ave |
Overall Sales |
| W5 1 | 0 | 0 | 877494 | 8 | 734687 | 8 | 421252 | 6 | 701135 | 22 |
| W5 2 | 2158333 | 3 | 950000 | 1 | 856500 | 2 | 752443 | 29 | 884539 | 35 |
| W5 3 | 1482000 | 5 | 1013750 | 4 | 626667 | 3 | 375133 | 15 | 702667 | 27 |
| W5 4 | 0 | 0 | 810000 | 2 | 704948 | 14 | 409722 | 9 | 607071 | 25 |
| W5 5 | 0 | 0 | 455000 | 1 | 677333 | 3 | 471000 | 3 | 557143 | 7 |
| Total | 1735625 | 8 | 881247 | 16 | 712392 | 30 | 565740 | 62 | 727867 | 116 |
| Change in Quarter | -15.8% | 33.3% | -17.7% | -27.3% | -11.6% | -3.2% | 13.0% | 6.9% | -5.4% | -0.9% |
| Change in year | 16.2% | 14.3% | 8.1% | 166.7% | -6.9% | 30.4% | -15.3% | -13.9% | -3.0% | 7.4% |
| Change in three years | 34.2% | 100.0% | -19.2% | -11.1% | -12.3% | -18.9% | 19.3% | -62.4% | 22.5% | -48.2% |
| Change in five years | 16.4% | -55.6% | 12.2% | -27.3% | 18.5% | -31.8% | 45.5% | -44.6% | 25.0% | -40.8% |
| Change in ten years | 271.9% | 166.7% | 55.5% | 6.7% | 70.8% | 42.9% | 111.9% | 72.2% | 93.1% | 54.7% |
| Ealing W13 Post Code Area Property Prices - (October - December 2018) | ||||||||||
|---|---|---|---|---|---|---|---|---|---|---|
Area |
Detached |
Sales |
Semi-detached |
Sales |
Terraced |
Sales |
Flat/ |
Sales |
Overall Ave |
Overall Sales |
| W13 0 | 0 | 0 | 674349 | 4 | 770000 | 4 | 357780 | 5 | 582023 | 13 |
| W13 8 | 1644000 | 1 | 900000 | 1 | 850000 | 1 | 417877 | 11 | 570761 | 14 |
| W13 9 | 769400 | 1 | 1046250 | 2 | 720846 | 13 | 388437 | 8 | 639183 | 24 |
| Total | 1206700 | 2 | 812842 | 7 | 738944 | 18 | 395544 | 24 | 605830 | 51 |
| Change in Quarter | - | - | -21.9% | -58.8% | -7.7% | -14.3% | -8.7% | -20.0% | -13.3% | -25.0% |
| Change in year | - | - | -25.0% | -53.3% | 0.8% | -33.3% | -10.9% | -31.4% | -13.3% | -36.3% |
| Change in three years | - | - | -24.1% | -41.7% | 0.6% | -58.1% | -9.4% | -41.5% | -10.3% | -48.0% |
| Change in five years | - | - | 8.5% | -58.8% | 38.0% | -45.5% | 28.4% | -53.8% | 14.7% | -52.8% |
| Change in ten years | - | - | 93.2% | 0.0% | 104.9% | -18.2% | 113.0% | 33.3% | 100.2% | 8.5% |
Source: Land Registry
March 26, 2019