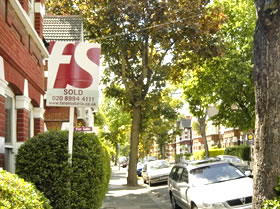
W4 Property Close to All Time High
Average sale price in Chiswick back over £600,000
Earlier figures suggesting an almost complete price recovery in the Chiswick property market have been confirmed by the latest official numbers.
Land Registry data released for the third quarter of 2009 shows that the average price of a Chiswick property was £601,488 up by 6.5% compared to last year.
Perhaps more importantly, activity in the market has picked up from the historic lows seen earlier this year. Sales volumes were up by 50% compared with the same period in 2008. Total volumes remain at half the levels seen when the market was at its most lively but estate agents now have reason to believe that the worst has passed for them.
Once again the changing mix of properties seems to be having an impact on the overall average. More detached and semi-detached properties were sold in the area than for some time. Terraced house prices in W4 are actually down by 11% over the year. Also the recovery in sales volumes for flats has been slower than other sections of the market which, in itself, tends to boost the overall average.
In the longer term a clear outperformance by houses over flats is becoming apparent with house prices generally up by over 40% over the last five years and flats rising by less than 20%.
London's annual house price change to the end of September according to the Land Registry is -3.2 per cent, which is the sixth month in a row in which London's rate of fall has eased. The average value of a property in London is now £314,954.
Right Move's House Price index, which is based on offered prices rather than sales prices, is showing that in October in London prices were back to an all-time high. The majority of buyers are expecting more rises and only 1 in 10 expecting falls
The figures for England and Wales as a whole in September show an annual movement of -5.6 per cent. This brings the average house price in England and Wales to £158,377. This is the fifth month in a row where the annual rate of decline has eased.
The numbers below are subject to revision as is it usual that some properties are added late to the Land Registry's database.
W4 Property Prices -July - September 2009
| Area | Detached | Sales | Semi-Det | Sales | Terrace | Sales | Flat/ Mais |
Sales | Total Avg | Total Sales |
|---|---|---|---|---|---|---|---|---|---|---|
| W4 1 | 1820000 |
4 | 1358000 | 5 | 694421 | 11 | 335967 | 17 | 741083 | 37 |
| W4 2 | 0 |
0 | 1175655 | 10 | 692063 | 15 | 327263 | 15 | 676161 | 40 |
| W4 3 | 0 |
0 | 793605 | 9 | 624166 | 12 | 345510 | 12 | 569047 | 33 |
| W4 4 | 0 |
0 | 1097375 | 4 | 785833 | 3 | 351744 | 18 | 523136 | 25 |
| W4 5 | 0 |
0 | 0 | 0 | 648357 | 14 | 360706 | 24 | 466683 | 38 |
| Total | 1820000 |
4 | 1074232 | 28 | 671710 | 55 | 345987 | 86 | 601488 | 173 |
| Change in Quarter | - | - | 17.5% | 154.5% | 4.0% | 48.6% | 16.2% | 75.5% | 20.2% | 78.4% |
| Change in year | - | - | 13.5% | 64.7% | -11.9% | 48.6% | 3.4% | 43.3% | 6.5% | 51.8% |
| Change in three years | - | - | 15.4% | -54.8% | 16.6% | -55.3% | 16.1% | -52.7% | 15.2% | -54.0% |
| Change in five years | - | - | 43.2% | -41.7% | 42.6% | -45.0% | 19.5% | -59.2% | 47.4% | -52.6% |
Roughly speaking the post code sector areas are as follows:
1 - Bedford Park and the north side of the High Road
2 - The south side of the eastern end of the High Rd down to the river at Corney Reach
3 - The Grove Park area and over to Strand on the Green
4 - The west of Chiswick between the A4 and Chiswick High Rd - (a high concentration of flats)
5 - The north west of Chiswick - Acton Green mainly
November 10, 2009
Related links
|
